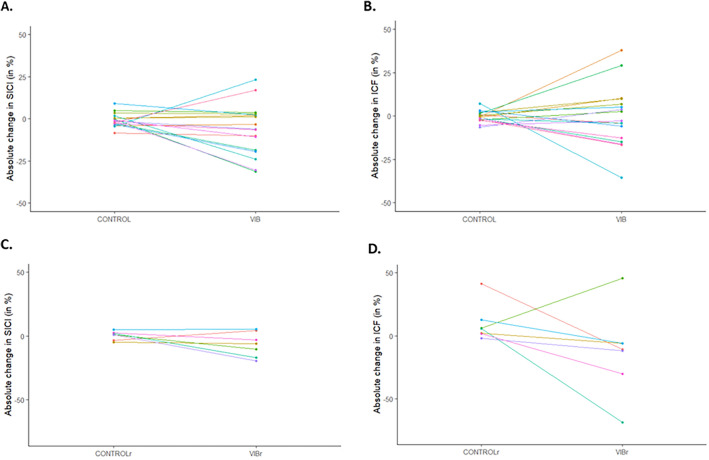
Figure 6.
Individual differences in absolute change in SICI (POST–PRE) for CONTROL and VIB conditions (panel A), absolute change in ICF (POST–PRE) for CONTROL and VIB conditions (panel B), as well as absolute change in SICI (POST–PRE) for CONTROLr and VIBr conditions (panel C) and absolute change in ICF (POST–PRE) for CONTROLr and VIBr conditions (panel D). Positive values indicate more inhibition (SICI) or facilitation (ICF) for POST than PRE measurements and negative values indicate less inhibition or facilitation. Participants are displayed with the same colour across panels (A–D).

