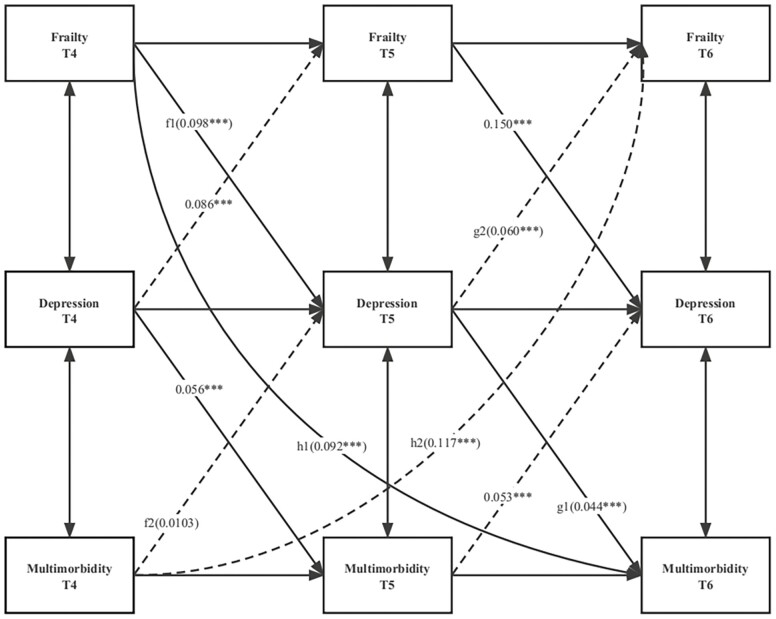
Figure 3.
Standardized path diagram of the cross-lagged mediation model; Survey of Health, Ageing, and Retirement in Europe (N = 22 786). ***p < .001; **p < .01; *p < .05; T4, Wave 4; T5, Wave 5; T6, Wave 6; model adjusted for age, sex, country, level of education, retirement status, and smoking and drinking status in Wave 4.

