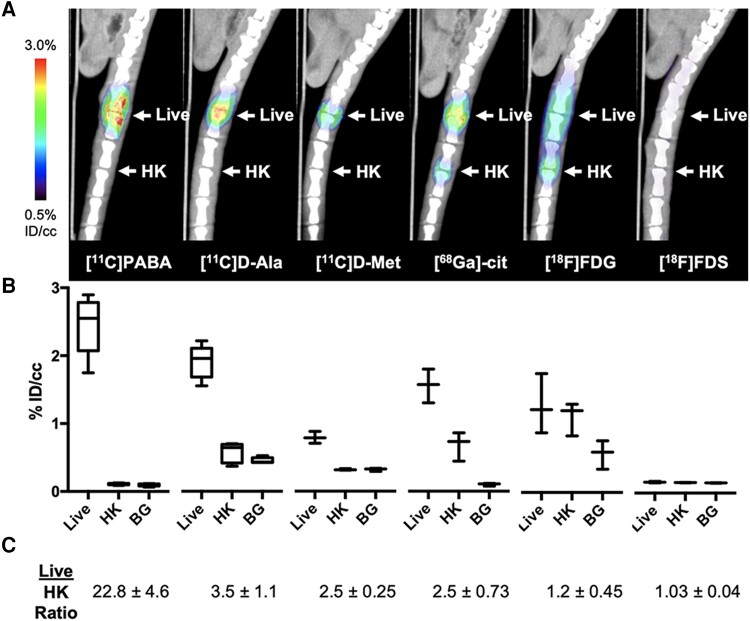
Figure 3.
Performance of positron emission tomography (PET) tracers in the rat Staphylococcus aureus vertebral discitis-osteomyelitis (VDO) model at 4 days postinoculation. Rats were inoculated with S aureus (live) or a 10-fold excess of heat-killed (HK) bacteria in adjacent intervertebral spaces on day 0 with technically successful VDO infections confirmed using a Xenogen IVIS 50 instrument and studied using micro-positron emission tomography–computed tomography (μPET-CT) on day 4. A, μPET-CT imaging of infected rats (n = 5 for [11C]PABA, n = 5 for [11C]D-ala N = 3 for other tracers). PET signals at day 4 postinoculation were detected at the site of inoculation for all tracers except [18F]FDS. B, Quantitative region of interest (ROI) analyses comparing inoculation of S aureus, 10-fold excess of HK S aureus, or background for the indicated tracers (background ROI was plotted for reference only). Statistically significant differences between live and HK levels were observed for [11C]PABA (P = .0003, n = 5), [11C]D-ala (P = .0011, n = 4), [11C]D-met (P = .0092, n = 3), and [68Ga]gallium citrate (P = .0011, n = 3), but not for [18F]FDG (P = .47, n = 3). No [18F]FDS uptake was observed for either live or HK S aureus. C, Ratio of live vs 10-fold excess of HK S aureus derived from ROI analyses of PET scans. Abbreviations: BG, background; HK, heat-killed; ID/cc, percent injected dose per cubic centimeter.

