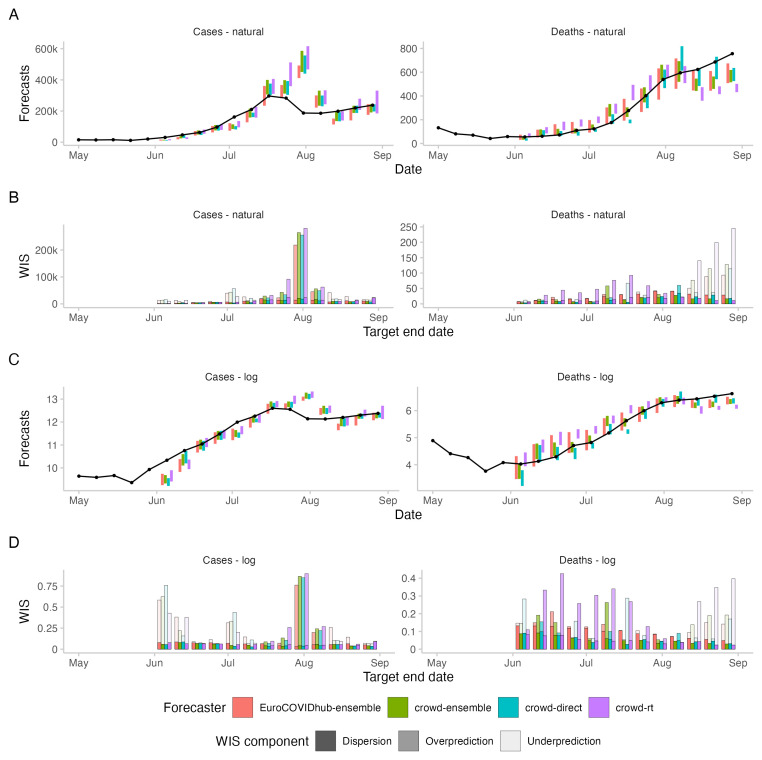
Figure 3. Forecasts and corresponding WIS for 2-week ahead forecasts of cases and deaths from COVID-19 in the UK.
A: 50% prediction intervals (coloured bars) and observed values (black line and points) for cases and deaths on the natural scale. B: Corresponding WIS values, decomposed into dispersion, overprediction and underprediction. C: 50% prediction intervals on the log scale, i.e., after applying the natural logarithm to all forecasts and observations. D: Corresponding WIS on the log scale, i.e., the WIS applied to the log-transformed forecasts and observations.

