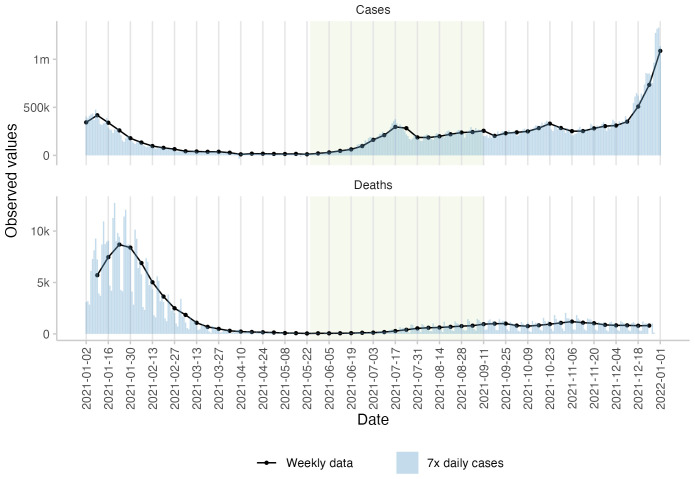
Figure 1. Observed cases and deaths of COVID-19 in the UK.
Observed daily (bars) and weekly (black lines and points) numbers of cases and deaths as available through the European Forecast Hub when the study concluded in 2021. The green rectangle marks the study period from May 24 until September 11, 2021. Daily numbers were multiplied by seven in order to appear on the same scale as weekly numbers.

