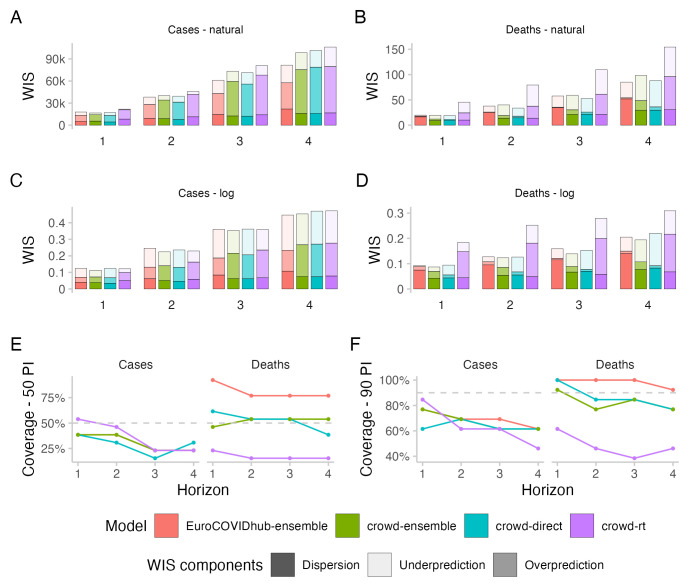
Figure 3. Predictive performance across forecast horizons.
A– D: WIS stratified by forecast horizon for cases and deaths on the natural and log scale. E, F: Empirical coverage of the 50% and 90% prediction intervals stratified by forecast horizon and target type. Grey dashed lines denote the nominal coverage that a model should ideally achieve.

