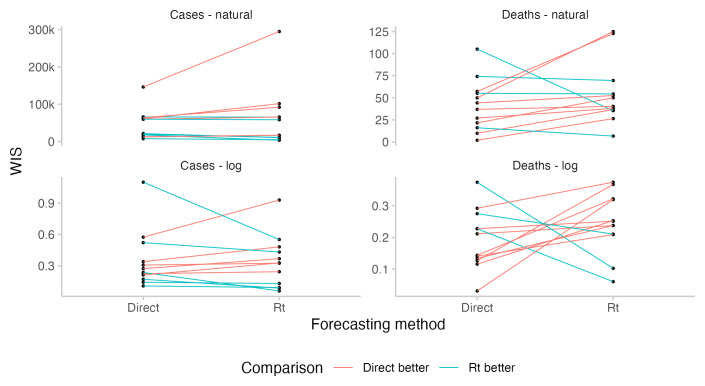
Figure 6. Comparison of predictive performance of individual forecasters using either the direct forecasting or R t interface.
Comparisons are based only on those instances where forecasters have submitted a prediction using both interfaces. The absolute level for a given forecaster relative to others is not meaningful as forecasters differ in the amounts of forecasts they have submitted and when.

