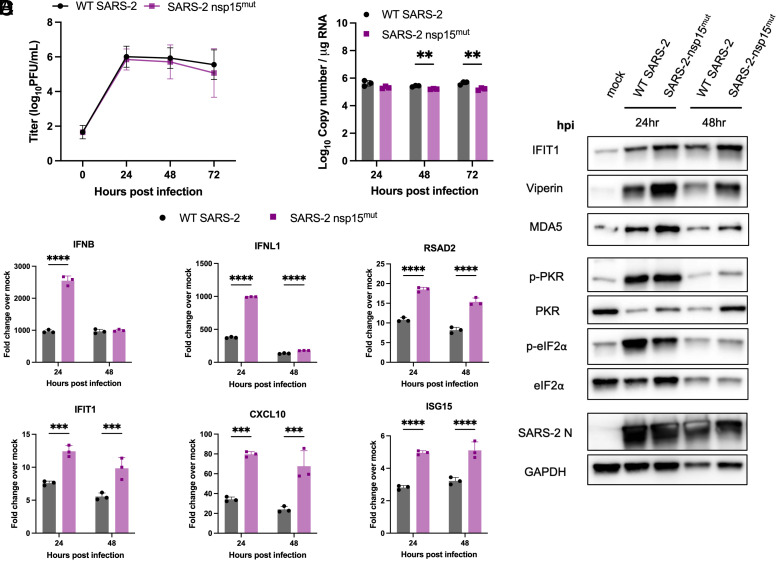
Fig. 3.
SARS-2 nsp15mut induces increased IFN mRNA and ISG expression in Calu3 cells compared to WT SARS-CoV-2. Calu3 cells were infected with either WT or nsp15mut SARS-CoV-2 at MOI 0.1 in (A) and MOI 1 in (B–D). (A) Supernatants were collected at 0, 24, 48, and 72 hpi and viral titers were measured by plaque assay. Data shown are the average of three independent experiments. (B and C) At the indicated time points post infection, intracellular RNA was extracted and analyzed by RT-qPCR. (B) Genome copy number was quantified using primers against SARS-CoV-2 nsp12 and a standard curve. (C) Relative mRNA expression of IFNB, IFNL1, and four representative ISGs: RSAD2, IFIT1, CXCL10, and ISG15. Fold change is expressed as 2−Δ(ΔCt). (D) Whole cell lysates were resolved using SDS-PAGE and analyzed via western blot analysis using antibodies against indicated proteins. Data in B–D are from one representative experiment of three total experiments.

