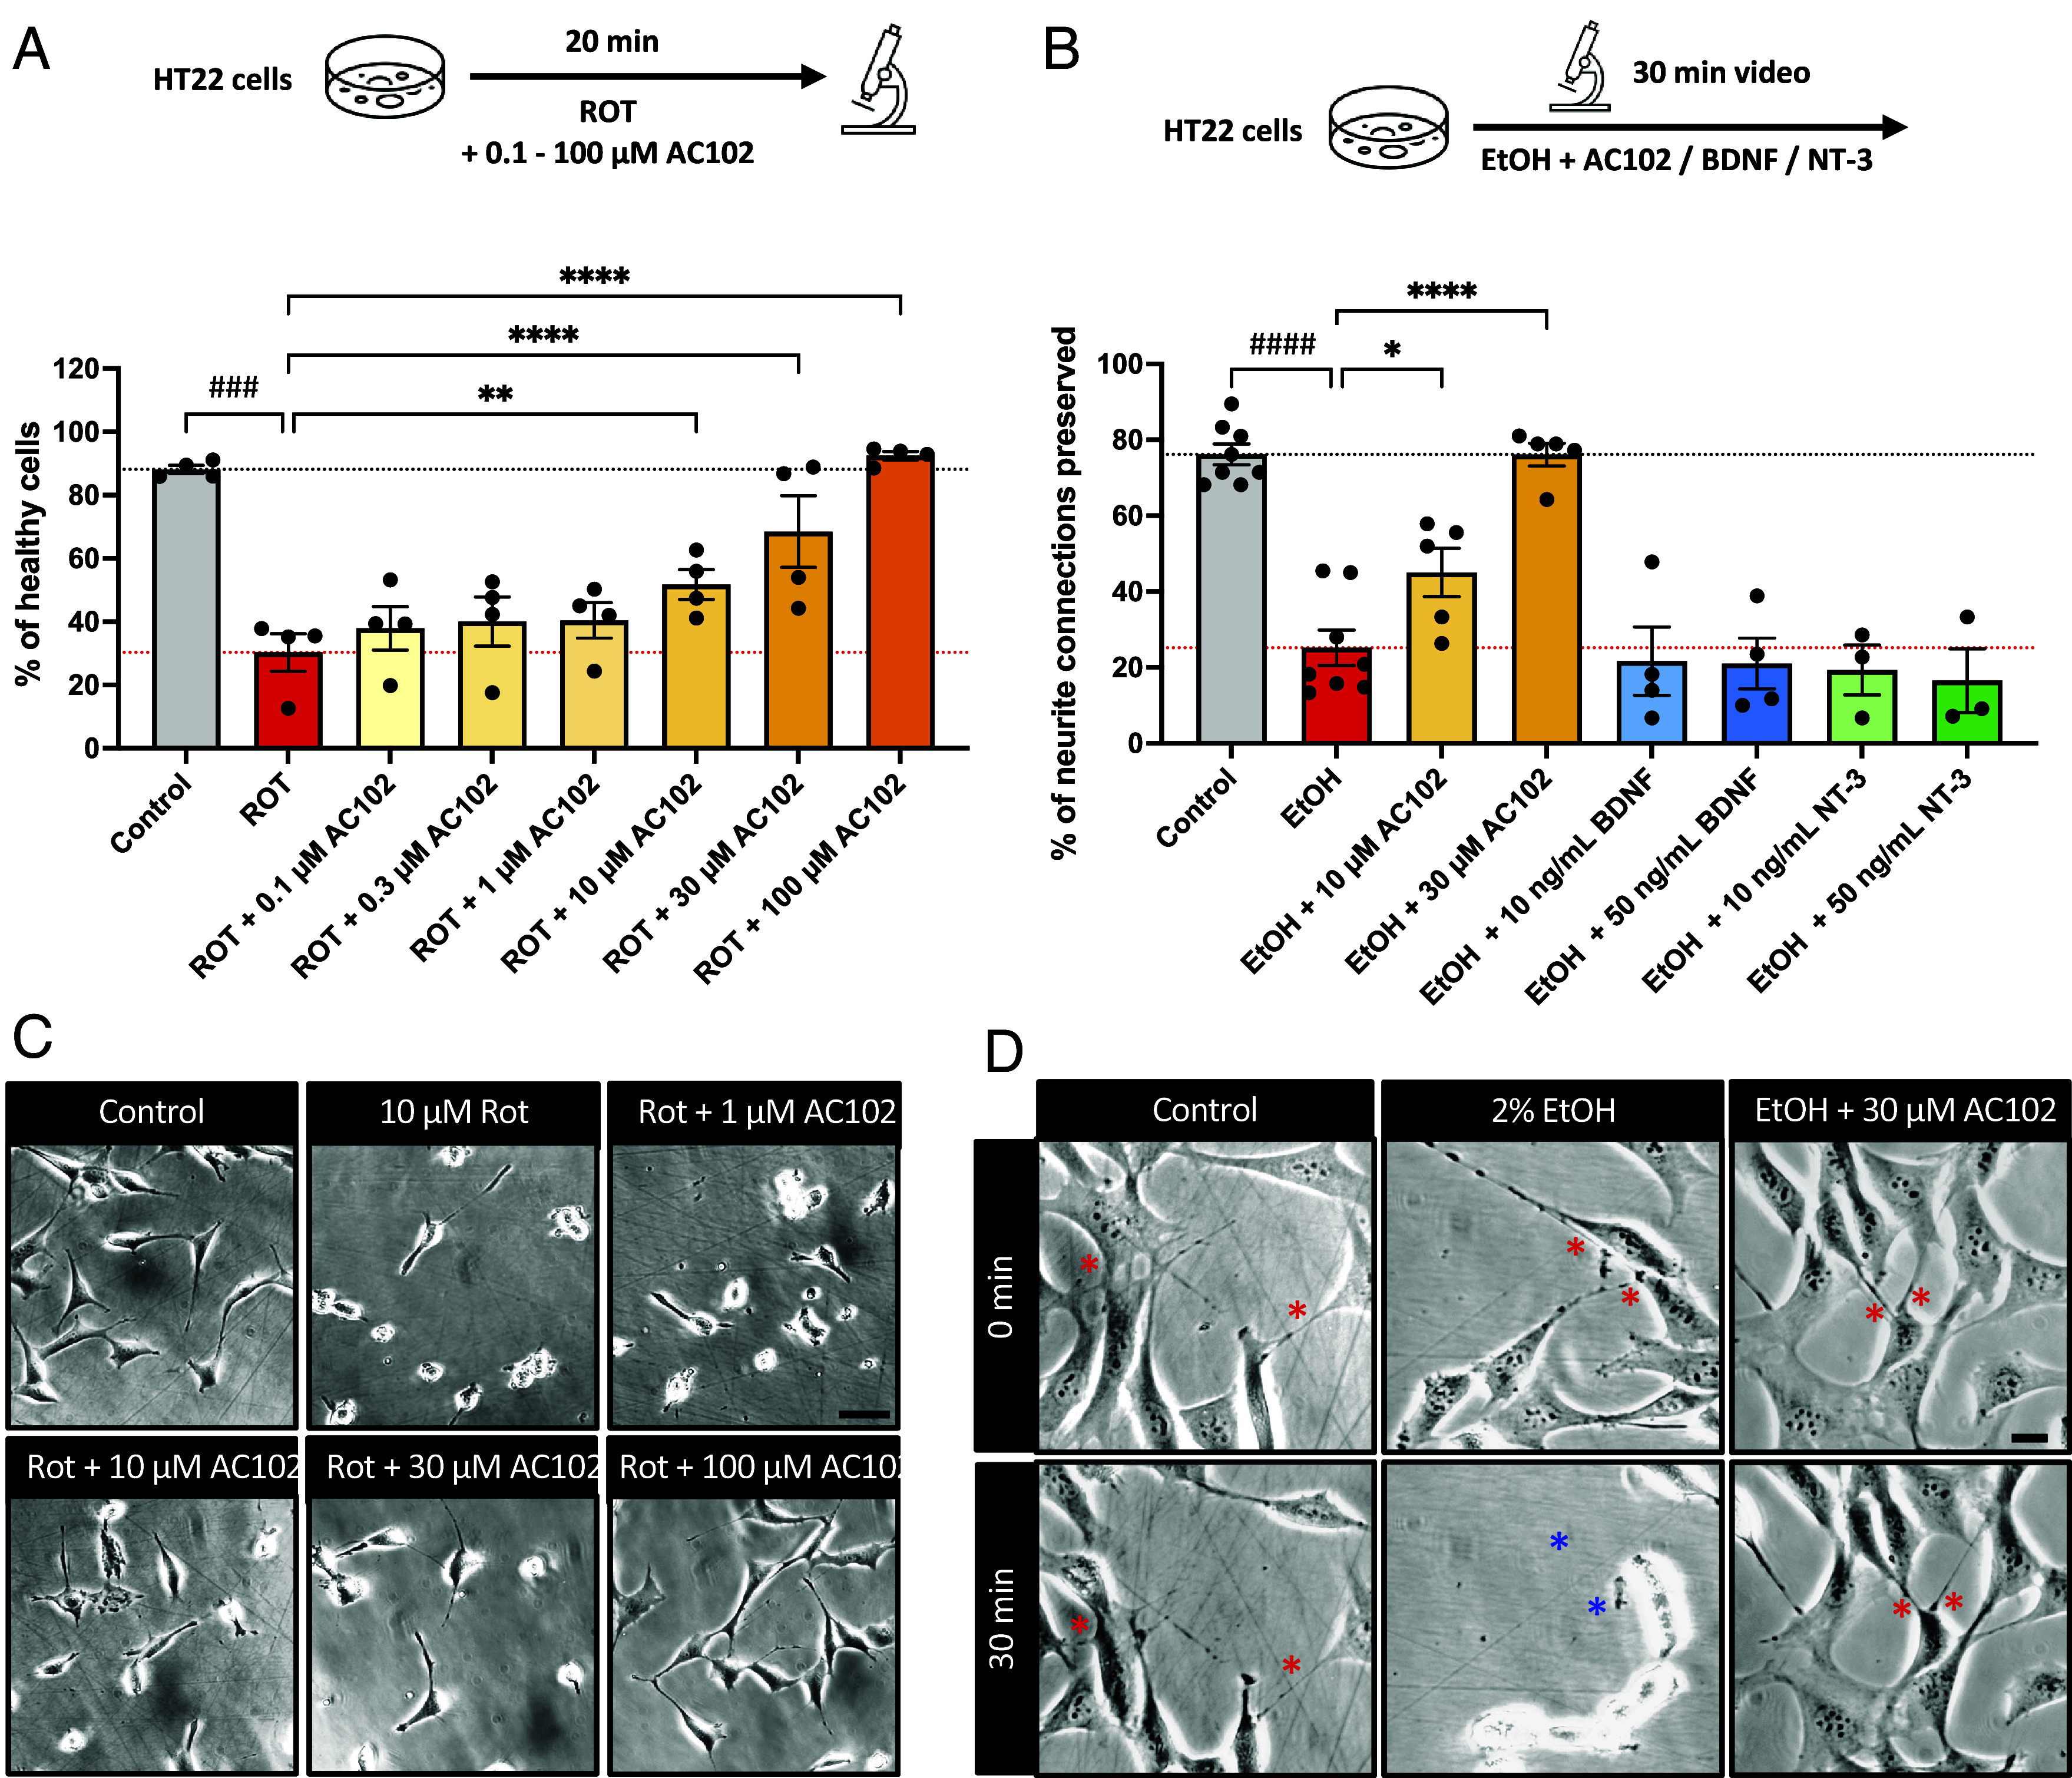
Fig. 4.

Protective effects of AC102 on cell damage and neurite connections. (A) Quantification of healthy cells in the presence of rotenone (ROT) alone or cotreatment of AC102. Shown are mean ± SEM of the percentage of cells that showed healthy morphology. n = 4 biological replicates (B) Quantification of preserved neurite connections in the presence of 2% ethanol (EtOH) alone or cotreatment of AC102. Shown are mean ± SEM of the percentage of neurite connections that were preserved throughout a 30 min observation period. n = 8 (for Control and EtOH), n = 5 (EtOH + AC102), n = 4 (EtOH + BDNF), n = 3 (EtOH + NT-3) biological replicates. ###P ≤ 0.001; ####P ≤ 0.0001 (one-sided paired t test); *P ≤ 0.05, **P ≤ 0.01, ****P ≤ 0.0001 (repeated measures one-way ANOVA and Fisher’s LSD test). (C and D) Representative images for A and B, respectively. Red asterisks indicate neurite connections and blue asterisks indicate lost connections. (Scale bar, 20 µm.)
