
Fig. 6.
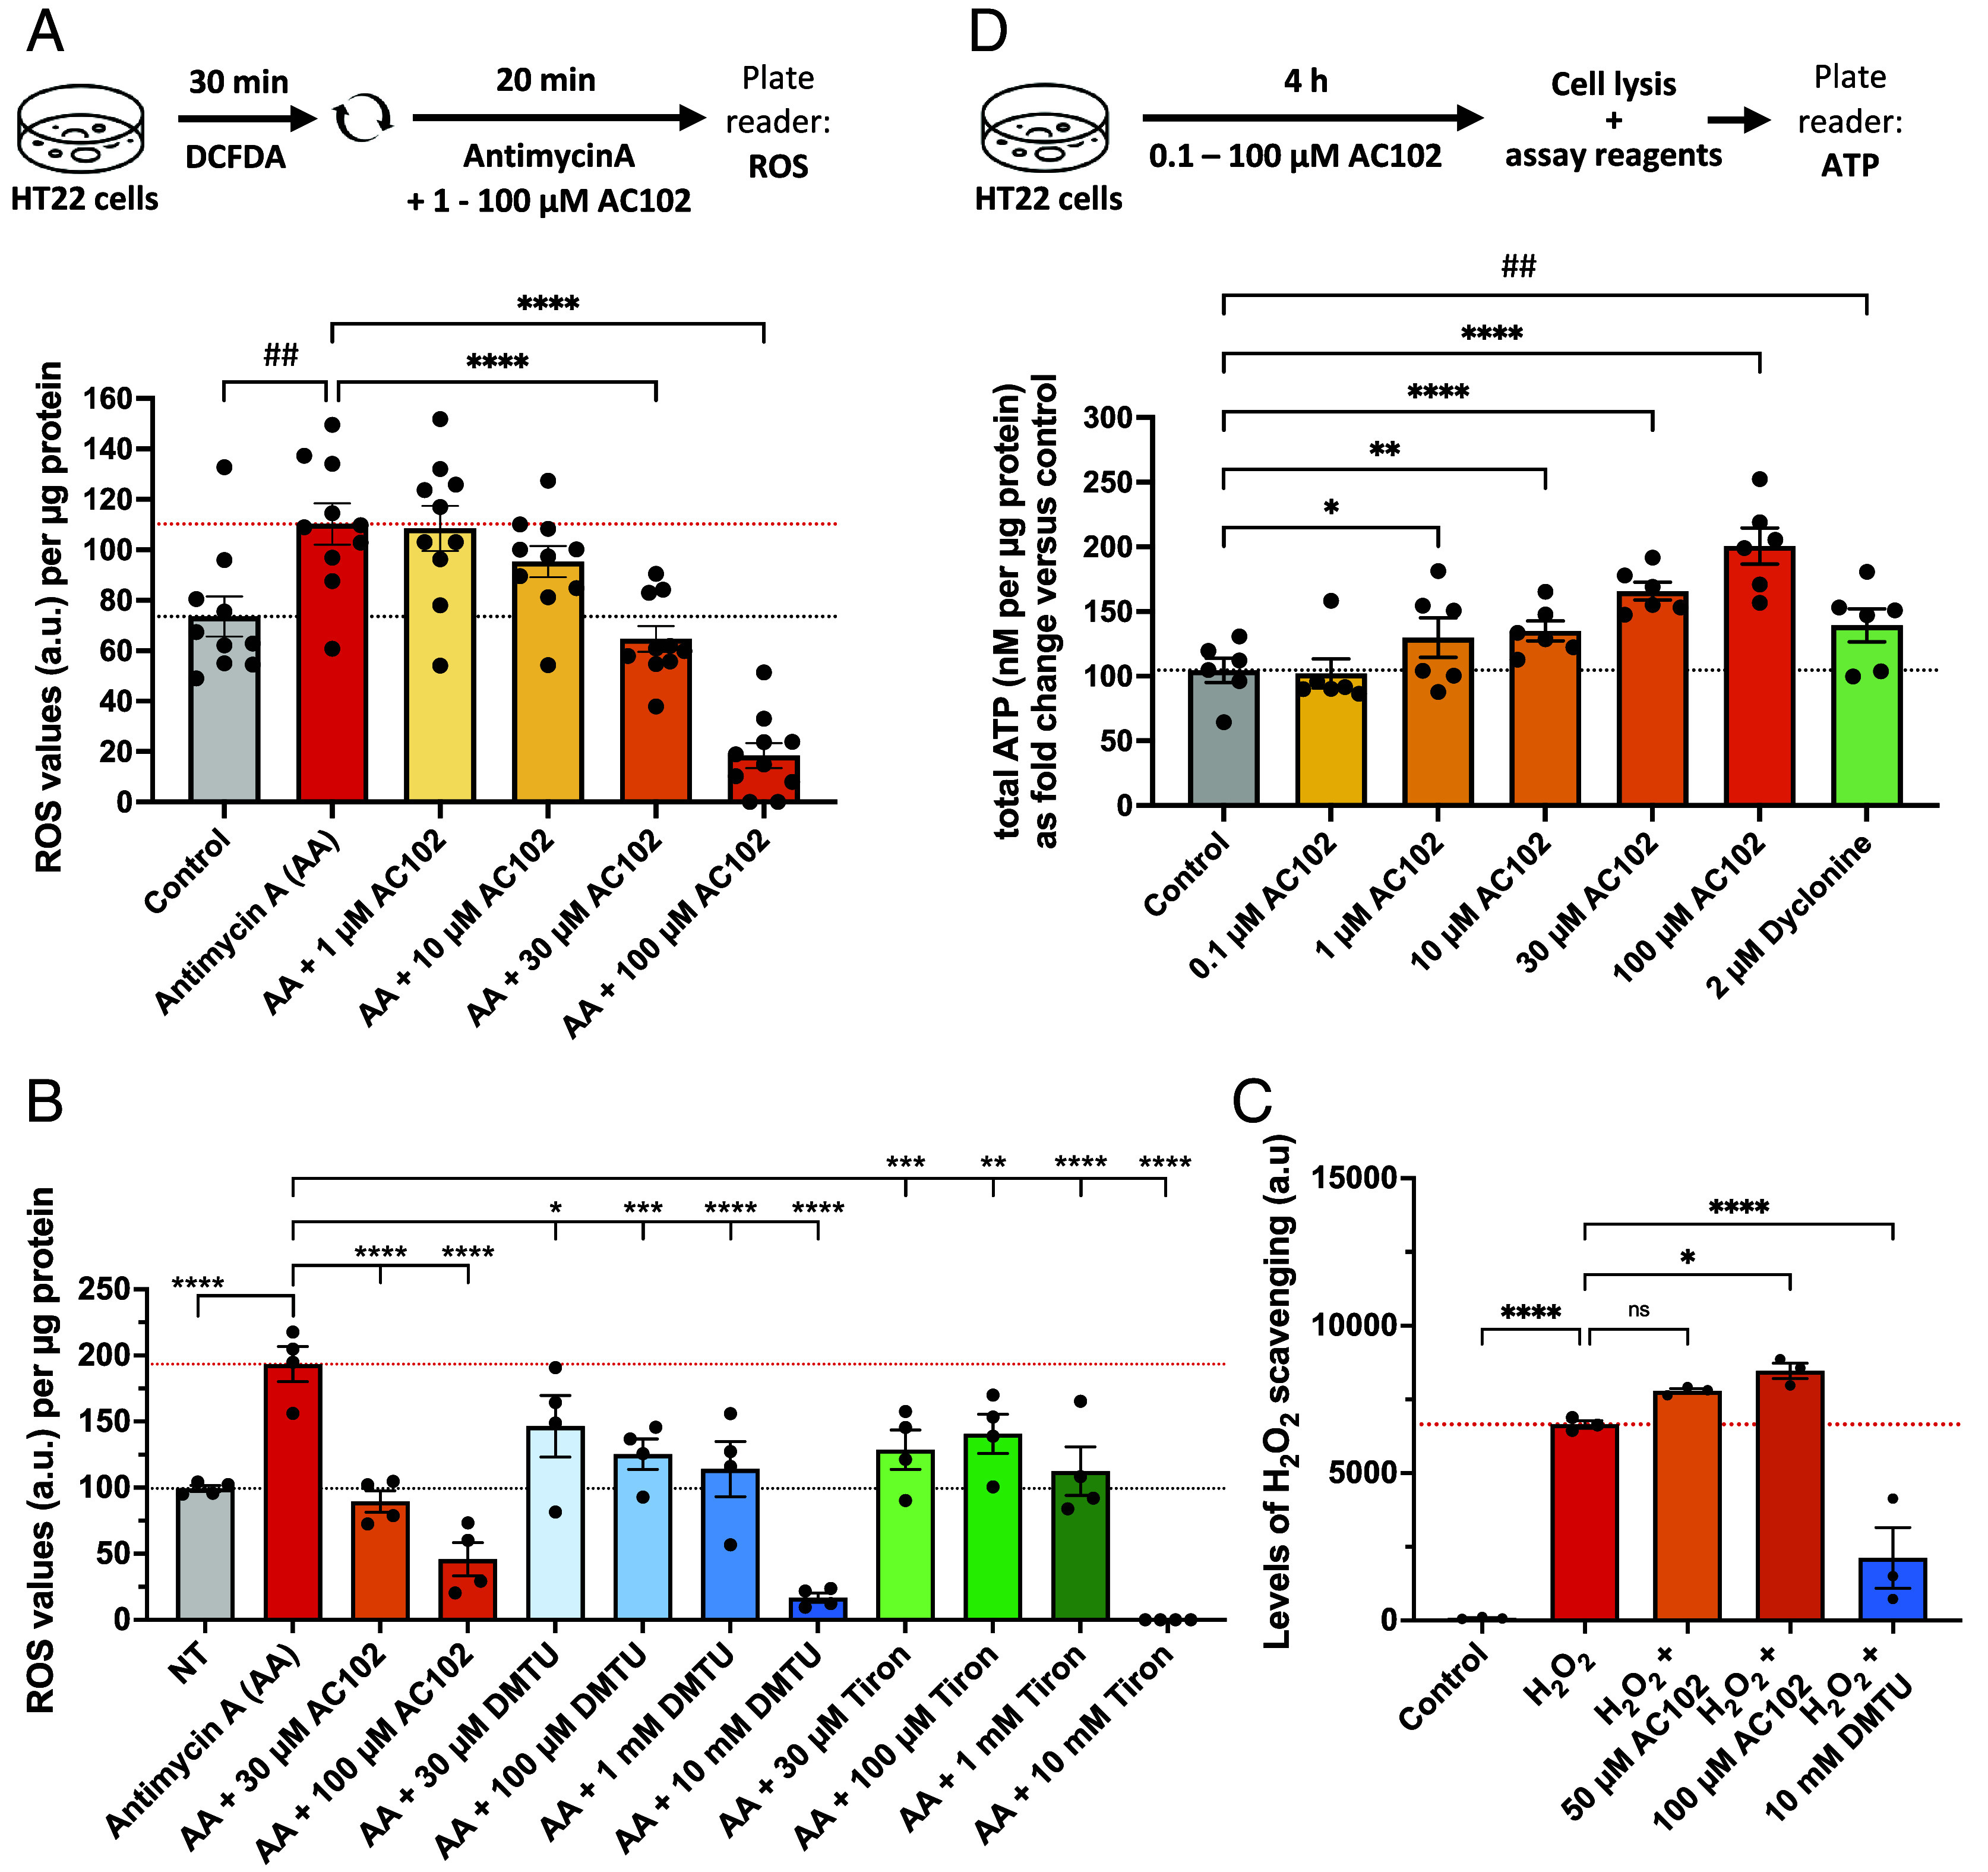
AC102 reduces ROS levels and elevates ATP production. (A) Quantification of DCFDA fluorescence in the presence of ROS inducer antimycin A alone or cotreatment with varying concentrations of AC102 (n = 10). (B) Quantification of DCFDA fluorescence in the presence of ROS inducer antimycin A alone (red) or cotreatment with selected concentrations of AC102 (orange) or cotreatment with varying concentrations of established ROS scavengers (blue, green) (n = 4). (C) Quantification of H2O2 scavenging in cell-free assay in the presence of AC102 or DMTU (n = 3). (D) Total ATP production of HT22 cells, treated with varying concentrations of AC102 or Dyclonine as positive control (n = 6). Shown are mean ± SEM. One-sided paired t test (##P ≤ 0.01). Repeated measures one-way ANOVA and Fisher’s LSD test for comparison of AC102-treated groups against vehicle (*P ≤ 0.05, **P ≤ 0.01, ***P ≤ 0.001, ****P ≤ 0.0001).