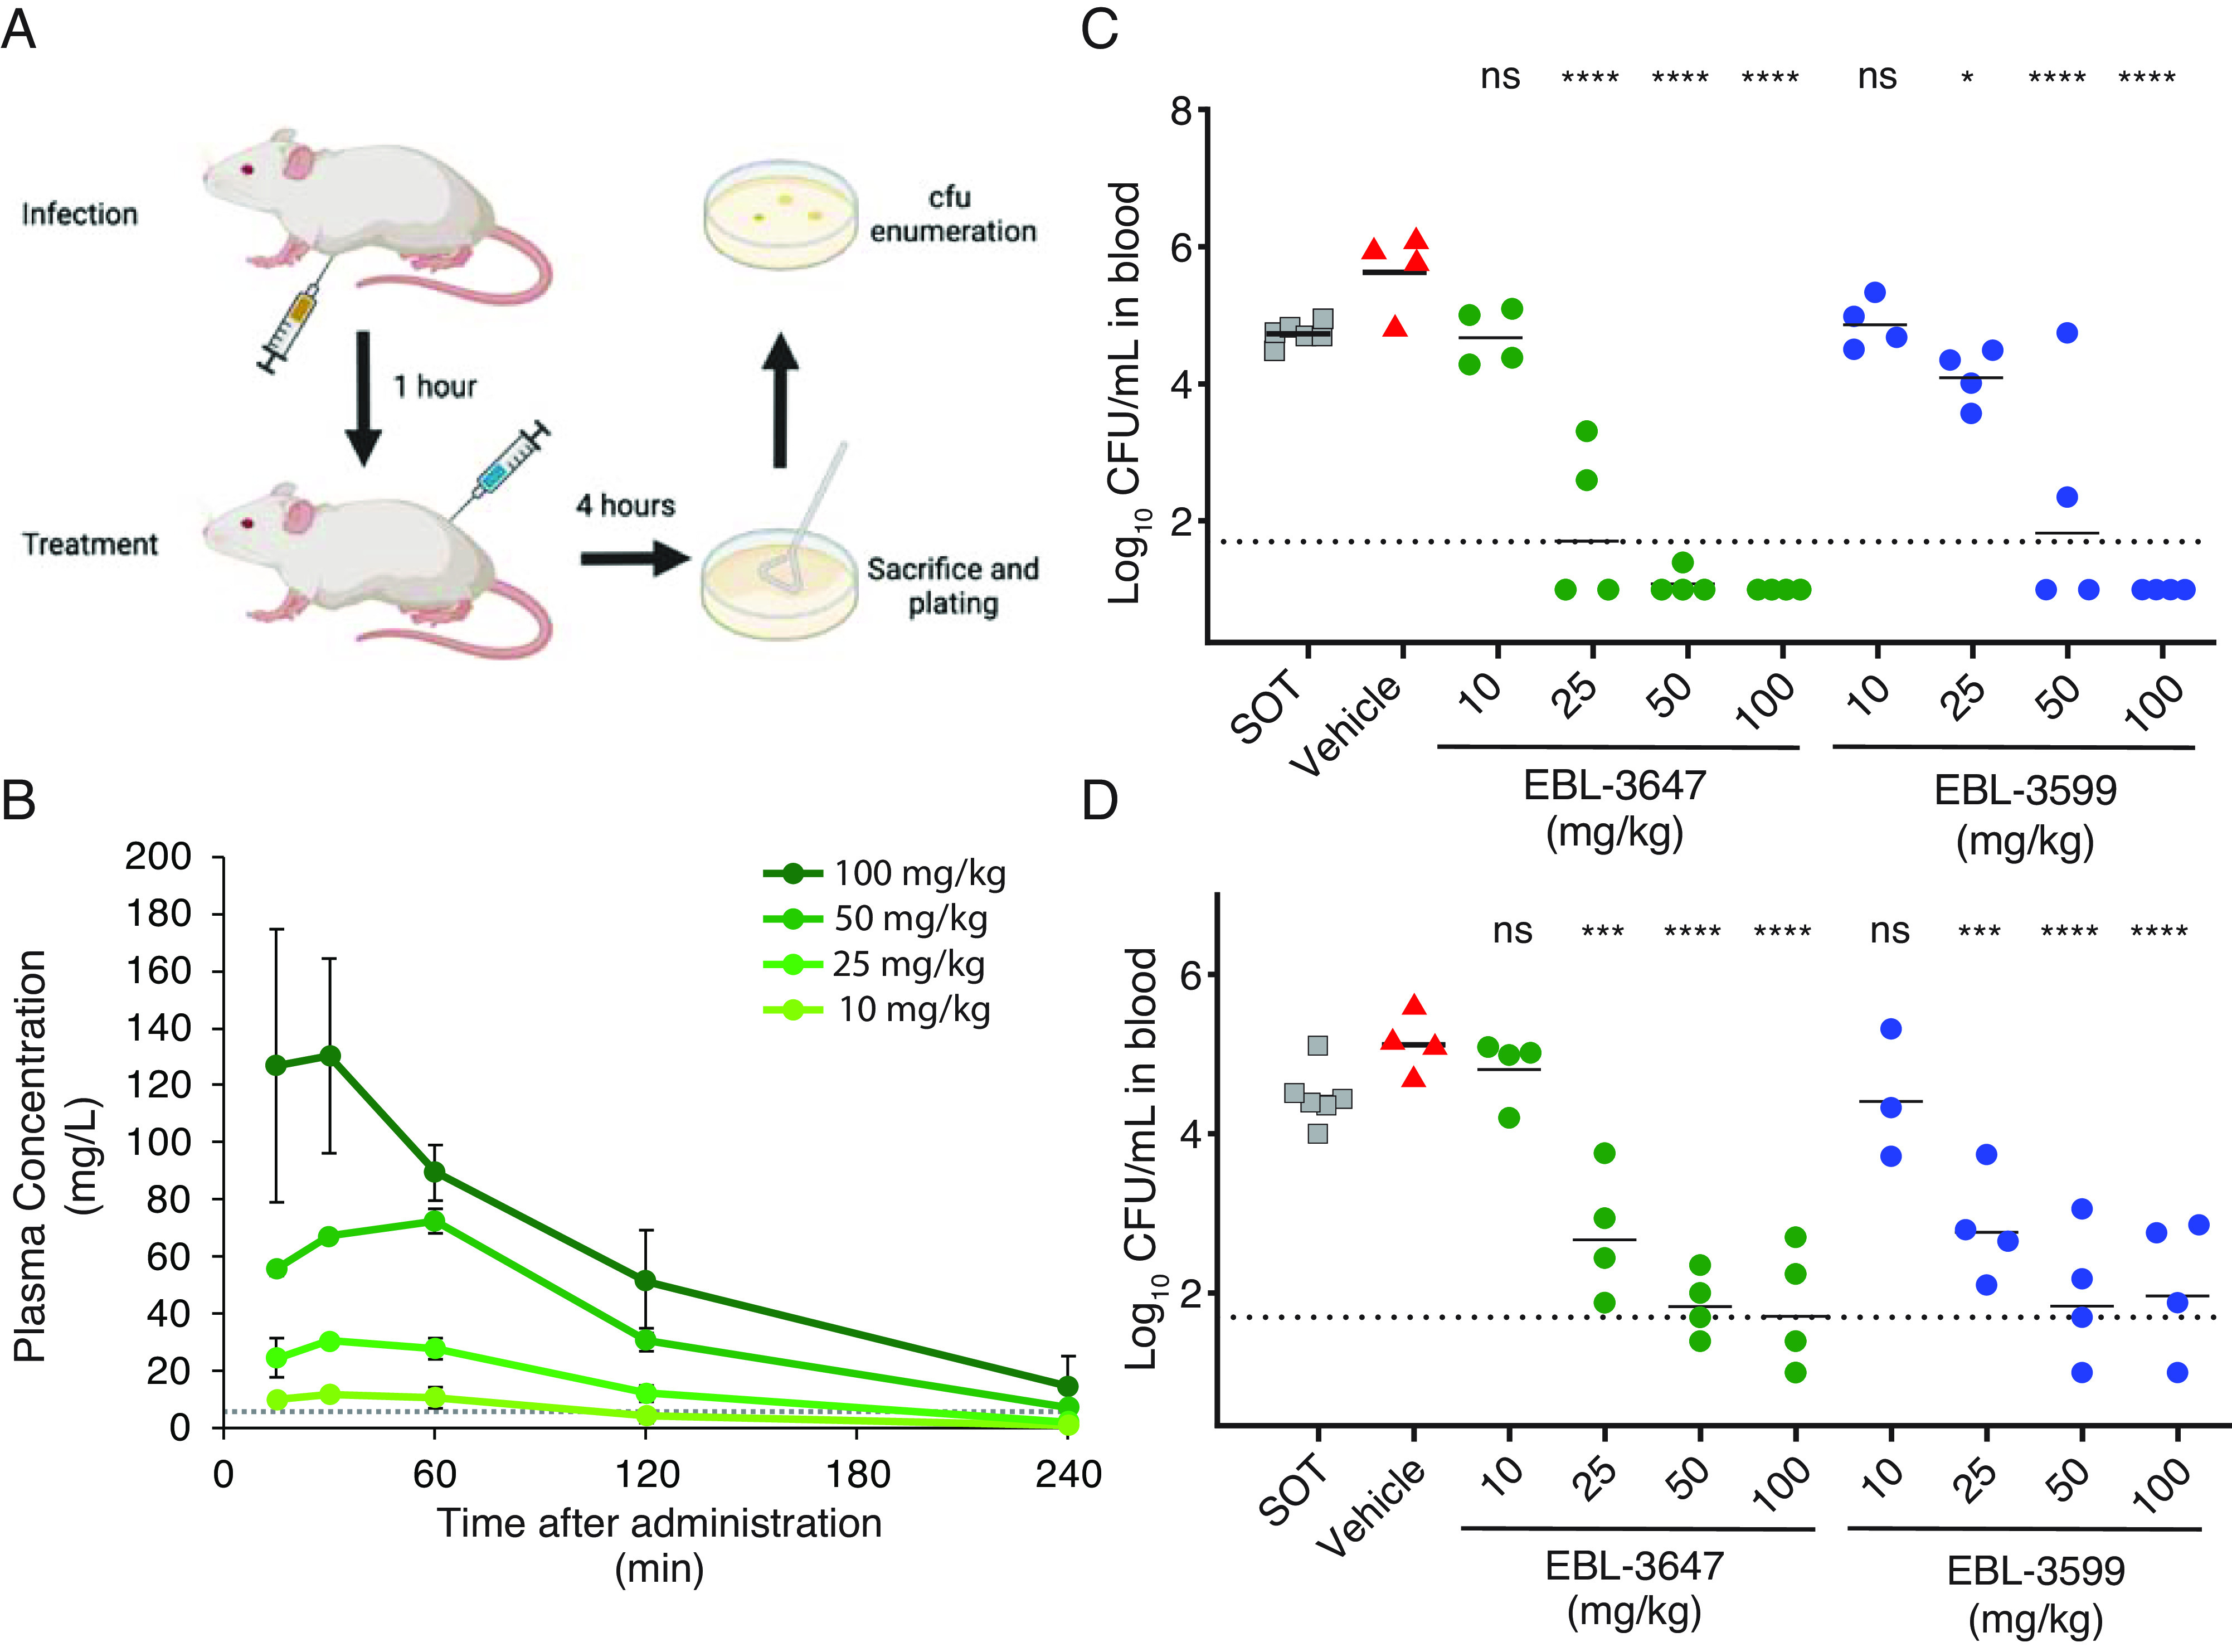
Fig. 4.

(A) Schematic of infection and treatment for in vivo peritoneal infection efficacy experiments. (B) Representative plasma PK graph for a single subcutaneous administration of EBL-3647 at various doses. The dotted line represents the MICs of the E. coli and K. pneumoniae strains used in the in vivo efficacy studies (4 mg/L). Results are represented as average concentrations ± SD from three to six mice. Corresponding data for EBL-3599 and calculated PK parameters can be found in SI Appendix, Fig. S6 and Tables S10 and S11. E. coli (EN122) (C) and K. pneumoniae (EN124) (D) blood bacterial counts in a dose–response efficacy study of EBL-3647 and EBL-3599 in a peritoneal infection model. The dotted line represents the limit of detection. Data for peritoneal fluid CFU can be found in SI Appendix, Figs. S7 and S8. Statistics for in vivo efficacy studies were calculated using a Dunnett’s multiple comparisons test versus vehicle treatment: ns not significant, *P < 0.1, ***P < 0.001, ****P < 0.0001.
