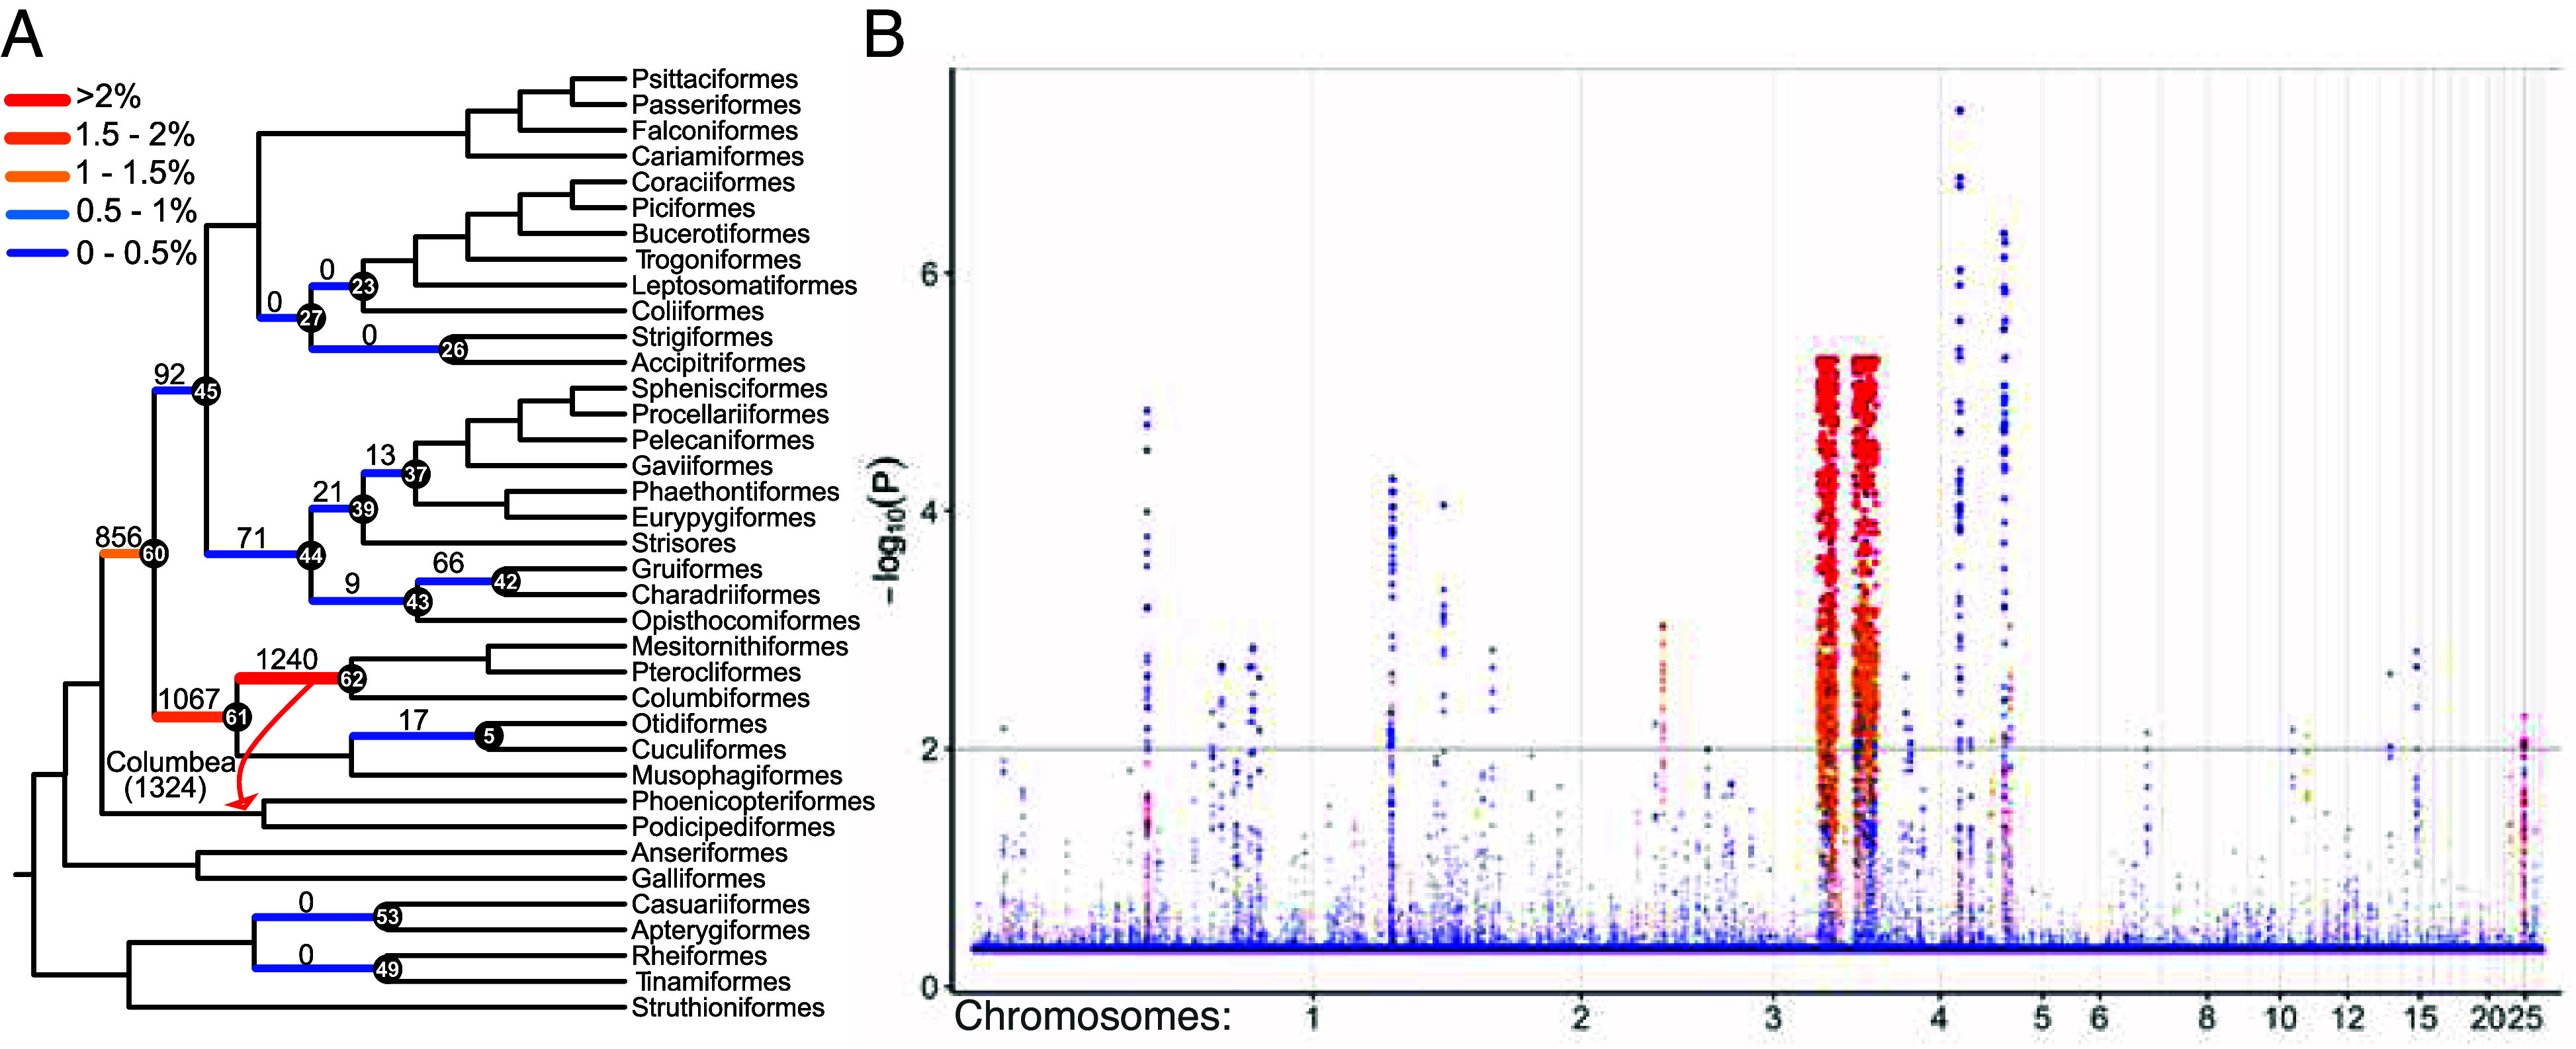
Fig. 3.

(A) The S2024 cladograms, marking in black and labeling (in white) 14 branches identified by Stiller et al. as having very high ILS, in addition to one controversial medium ILS branch (node 49). For these 15 branches and the Columbea branch of J2014 (red arrow), we use quartet frequencies to statistically test (Materials and Methods) whether each sliding window of 20 consecutive loci (i.e., 200 Kbp) supports the branch at levels that fall outside of the normal range for that node established using all windows. Branch labels and colors show the number and percentage of windows that support each branch at unexpected levels, defined as a -value after Benjamini–Hochberg (BH) multiple testing correction. (B) A Manhattan plot, showing the -values for each window and each identified branch, coloring branches similarly to (A). Only chromosomes 1 to 28 are included; we excluded sex chromosomes because they are expected to have atypical coalescent histories.
