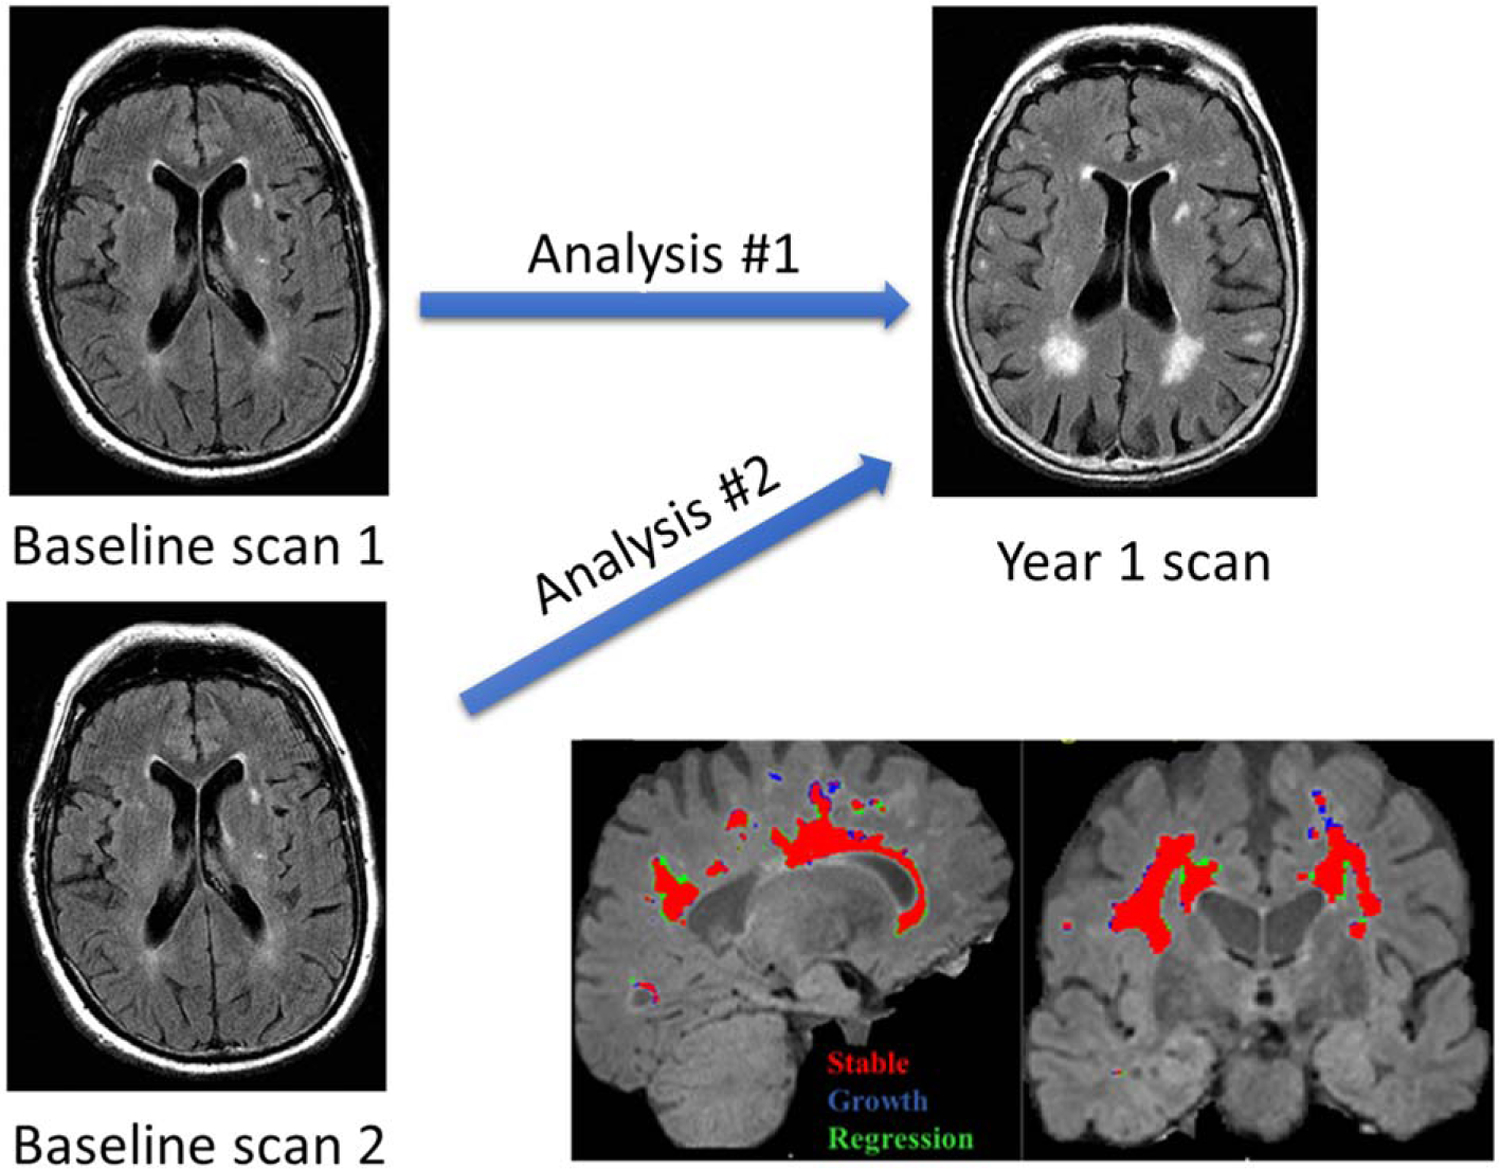
Fig. 1.

Strategy for determining test-retest repeatability for this longitudinal protocol and the source of image acquisition variability. A) This figure schematically illustrates the test-retest study design that utilized a comparison of two unique baseline scans with a single follow-up visit scan. B) Dynamic WMH changes within an individual subject are shown, (Red: Stable, Blue: Growth, Green: Regression).
