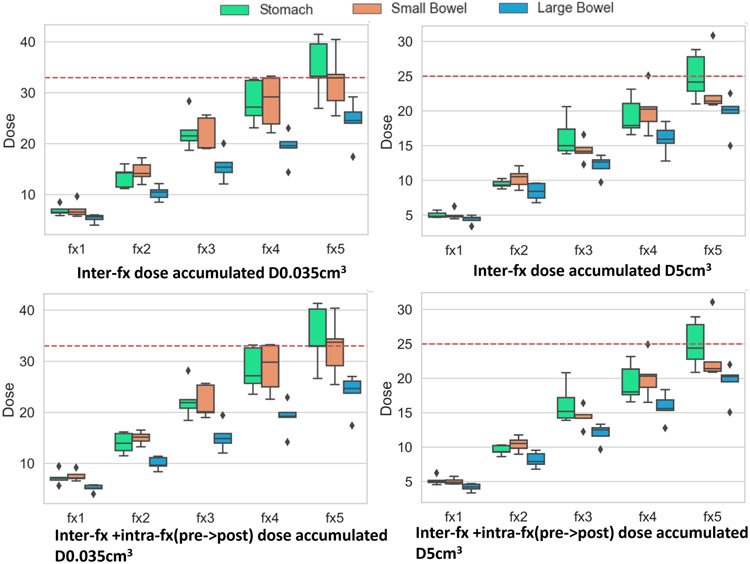
Figure 11:
Box plots showing accumulated dose metrics D0.035cm3(left) and D5cm3 (right) for stomach duodenum, small bowel and large bowel from interfraction (top row) and inter + intrafraction (bottom row) accumulated dose of all patients for all 5 fractions. Dotted horizontal line represents the instituitional constraint of 33 Gy (left) for D0.035cm3 and 25 Gy (right) for D5cm3.

