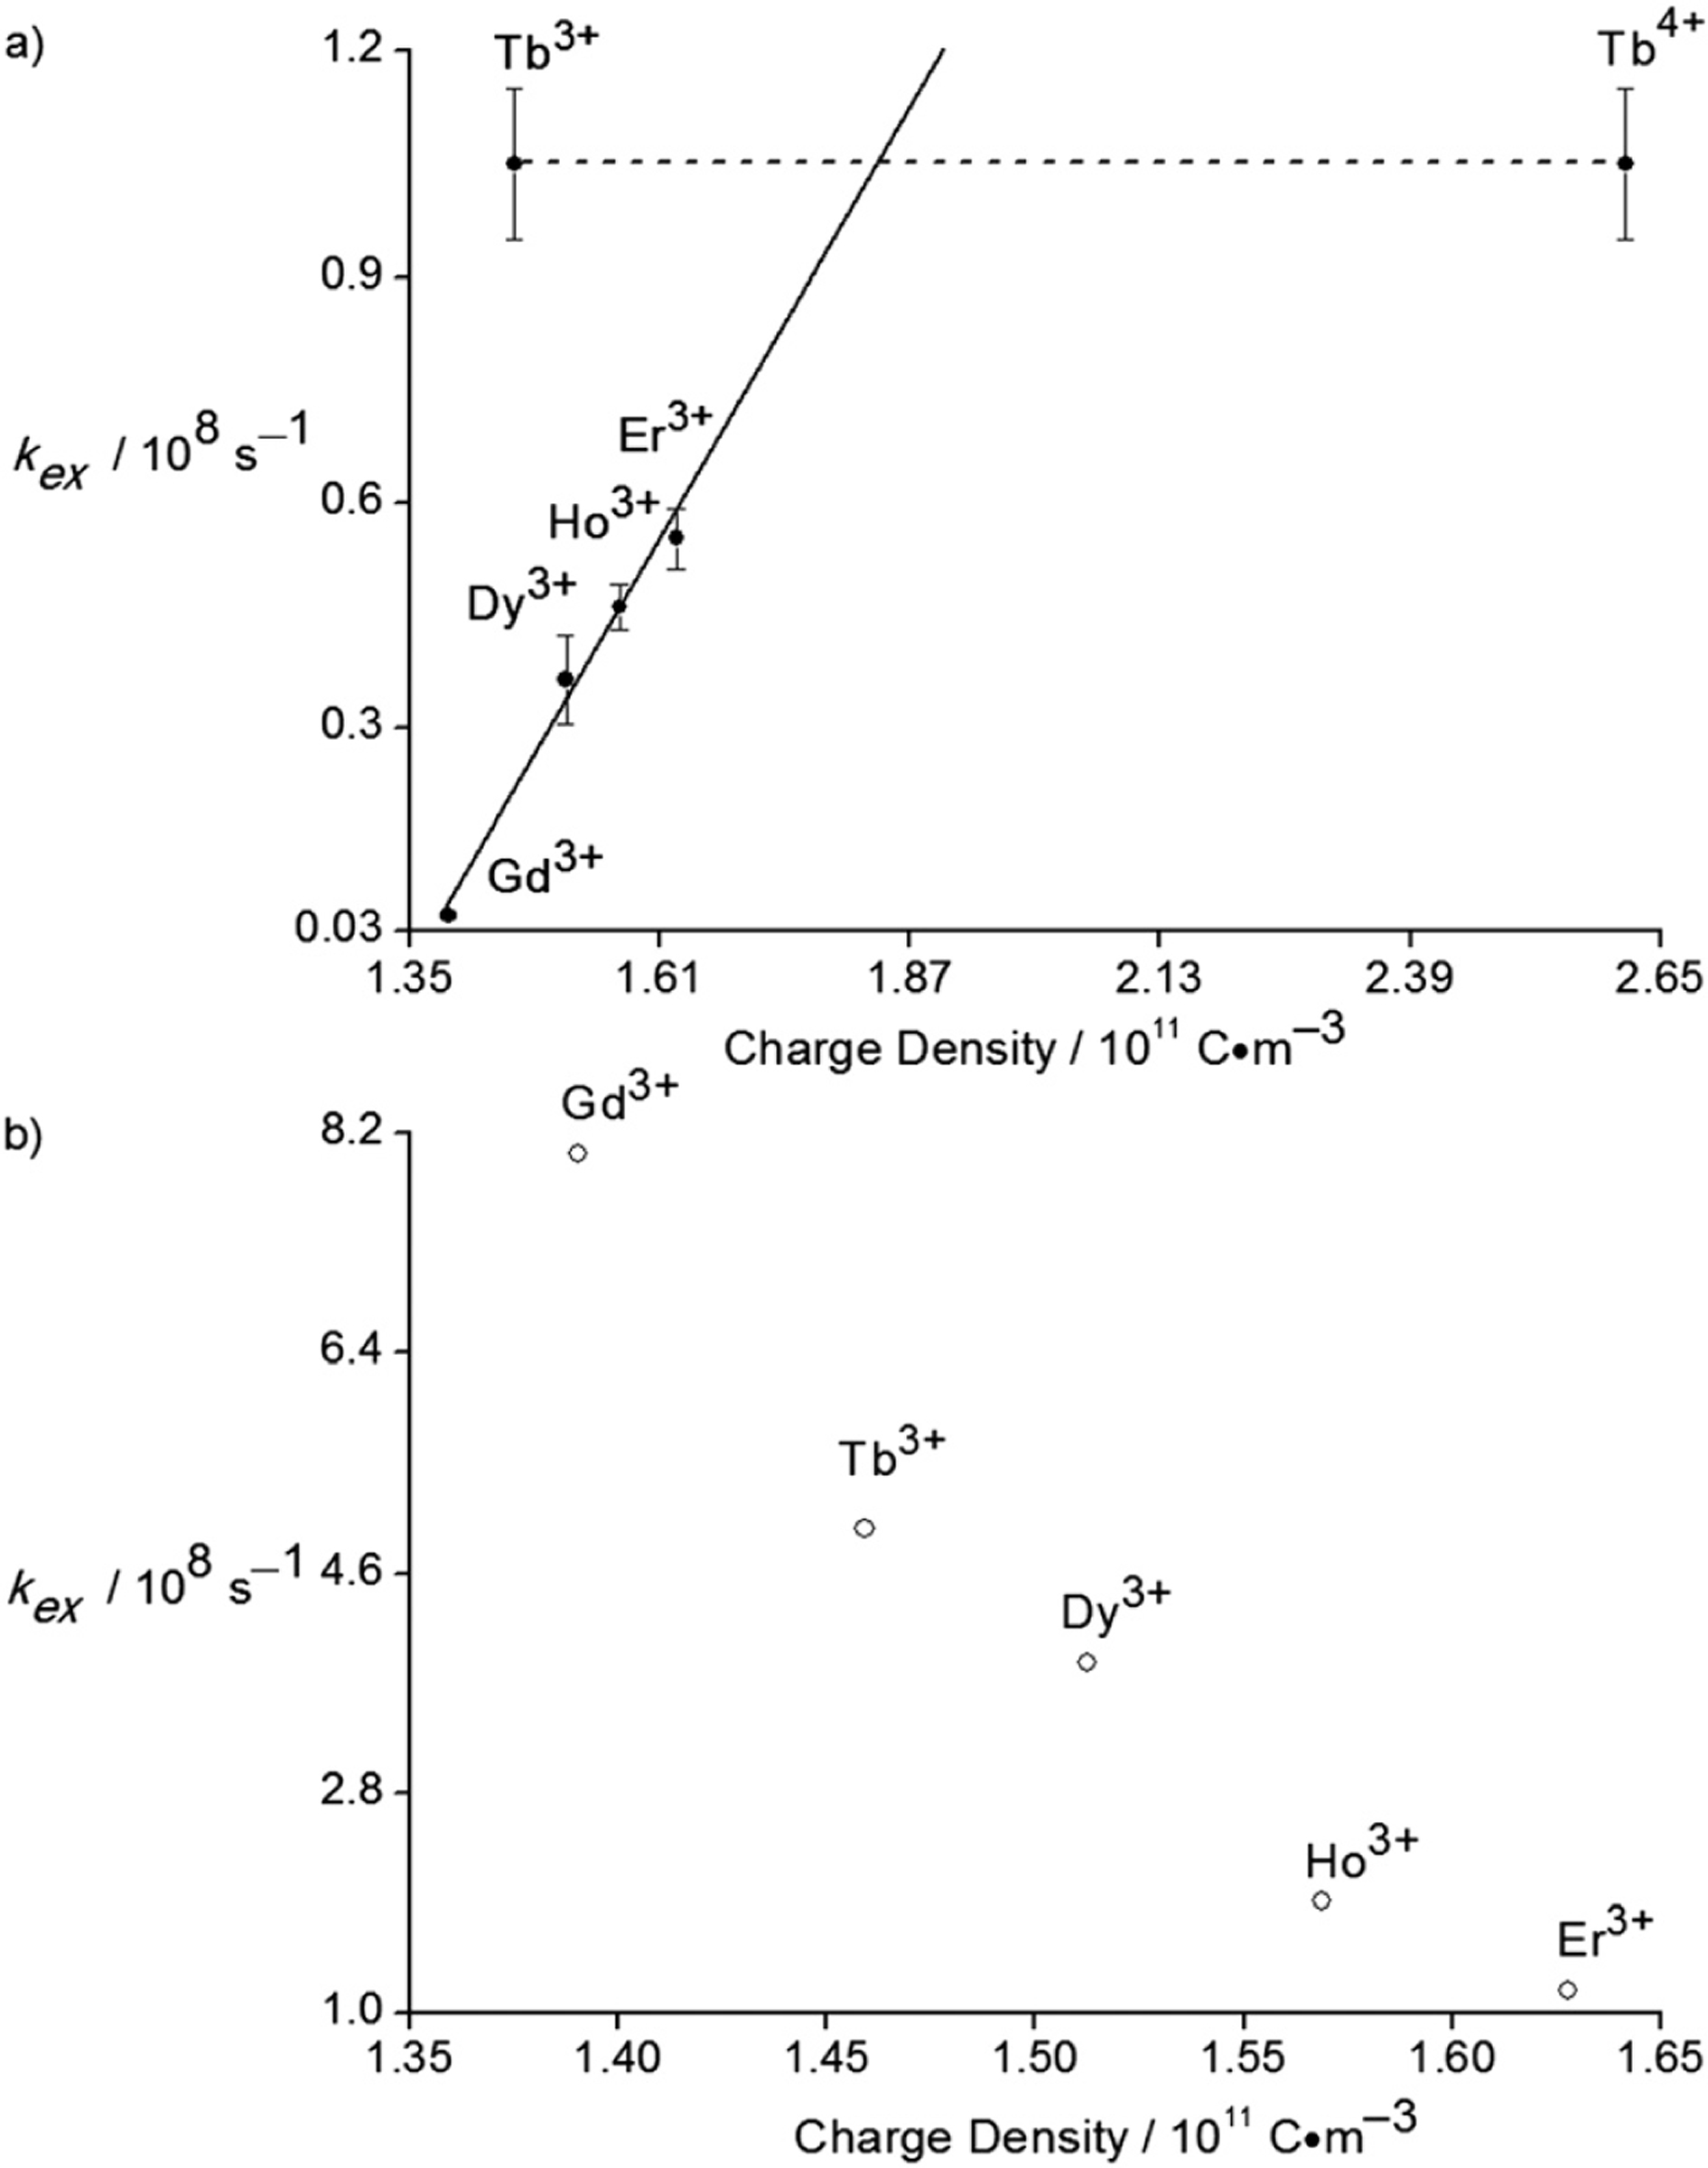
Fig. 2.

(a) Water-exchange rates of lanthanide ions in H2O–EMIES (1 : 19, v/v) at 298.15 K as a function of charge density. Solid dots represent the means of three or four independently prepared measurements. Error bars represent standard errors of the means (error bars for Gd3+ are smaller than the dot). The solid line is the linear fitting of the water-exchange rates of Gd3+, Dy3+, Ho3+, and Er3+. The dashed line is a guide for the eyes to connect the points for Tb3+ and Tb4+. The intersection of the solid and dashed line is the estimated average charge density of the Tb species in EMIES based on fitting. (b) Water-exchange rate of lanthanide ions in water at 298.15 K as a function of charge density.16
