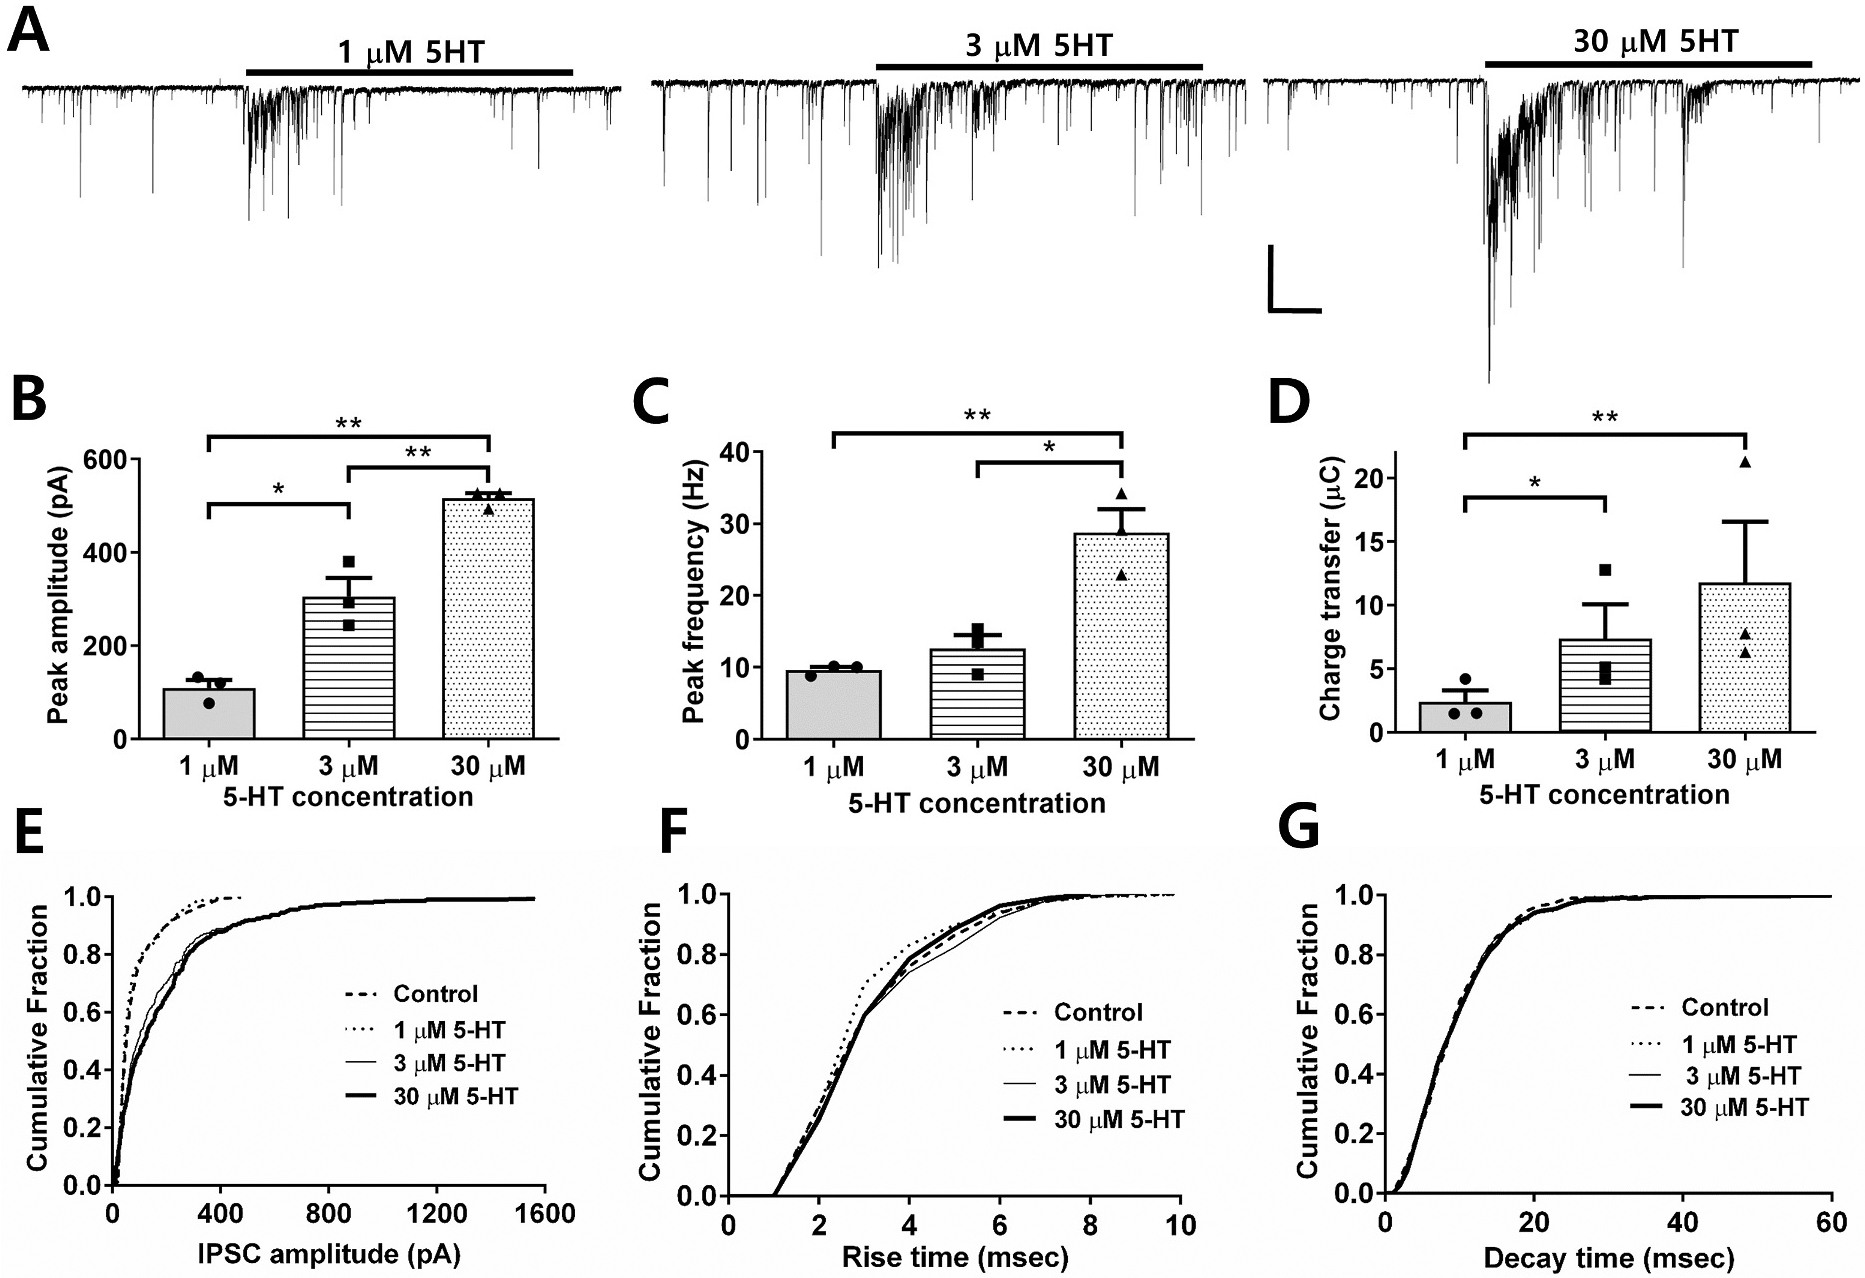
Fig. 1. 5-HT increases the frequency and amplitude of spontaneous IPSCs.

A. Representative sIPSC traces before, during and after exposure to different concentrations of 5-HT. Scale bar = 100 pA, 5 s. B. Bar graph showing peak amplitude of IPSCs evoked by the different 5-HT concentrations (n = 3) C. Bar graph showing peak frequency of IPSCs evoked by the different 5-HT concentrations (n = 3) D. Bar graph showing charge transfer of IPSCs evoked by the different 5-HT concentrations (n = 3). (unpaired t-tests *P < 0.05, **P < 0.001). Cumulative probability distributions for E. IPSC amplitude, F. Rise time, and G. Decay time.
