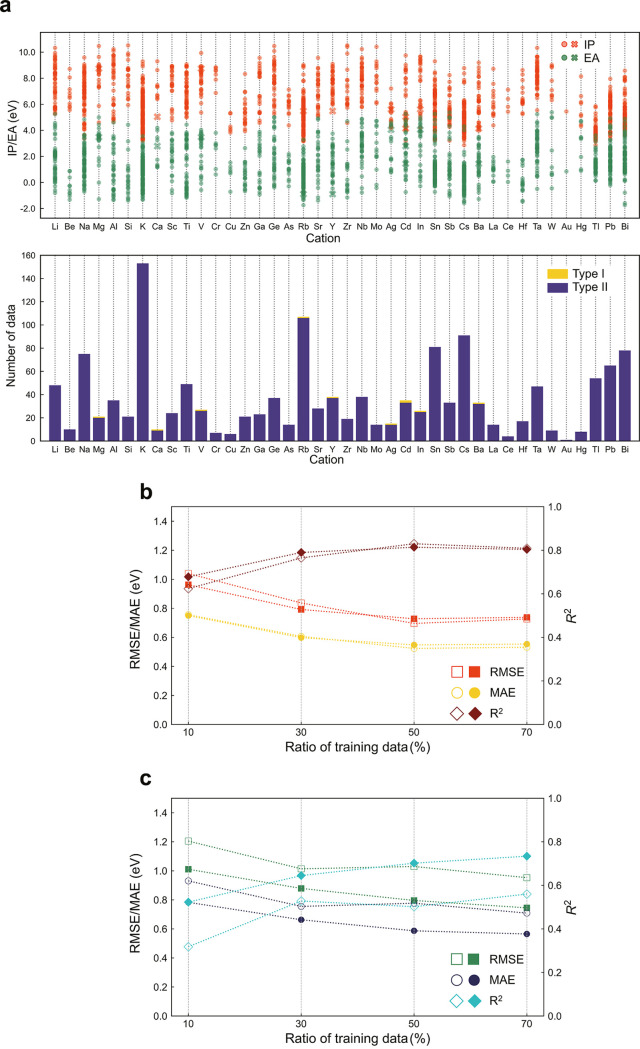
Figure 6.
Distribution of theoretical IPs and EAs of ternary oxides and prediction accuracy of transfer learning. (a) Distribution of theoretical IPs and EAs. Ternary oxides include two cation species, and the same data points are shown at both cation species. The other details are the same as those for Figure 2a. (b,c) Prediction accuracy of transfer learning for IPs and EAs, respectively. The filled and open symbols are the results of the ANN w/L-SOAP and the ANN w/AL, respectively. The horizontal axis is the ratio of the ternary data for training to all ternary data.

