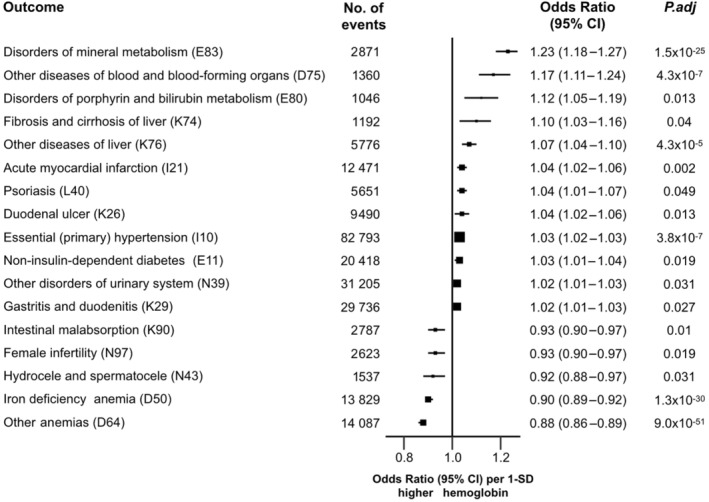
Figure 2. Associations of a genetic risk score for hemoglobin with different disease outcomes in UK Biobank.

Odds ratios obtained from PheWAS represent the estimates for the effect of 1‐unit higher genetic risk scores for hemoglobin (GRS‐hemoglobin), after adjusting for age, sex, center, genotyping array, and genetic principal components (the first 10 principal components). Analyses were restricted to outcomes with greater than 1000 cases (377 diseases) and showed the associations that survived from the multiple testing. International Classification of Diseases, Tenth Revision codes were also shown in the parentheses for each outcome. Error bars represent 95% CIs. All statistical tests were 2‐sided, following a correction for multiple testing using a strategy controlling for the false discovery rate. GRS indicates genetic risk score; and PheWAS, phenome‐wide associations.
