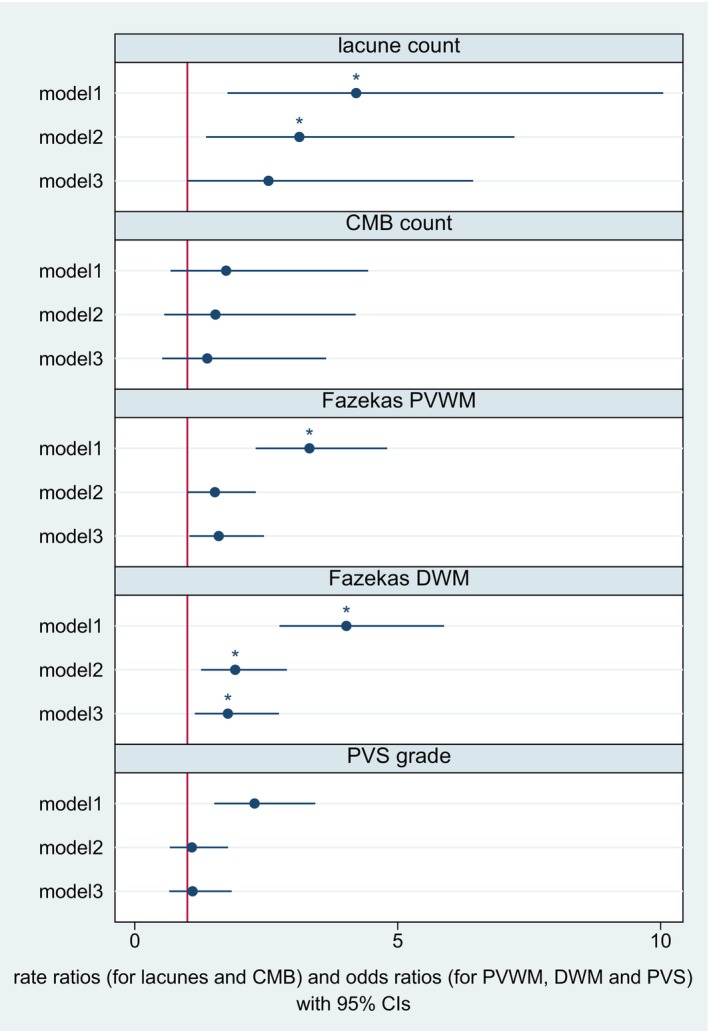
Figure 5. Hs‐cTnT and individual cerebral small vessel disease markers in their entire range.

The figure displays odds ratios derived from ordinal regression models for periventricular WMH grade, deep WMH grade, and PVS grade. The figure displays rate ratios calculated using negative binomial regression models for lacune count and CMB count. Model 1: unadjusted. Model 2: adjusted for age and sex. Model 3: additional adjustment for hypertension, diabetes, hyperlipidemia, coronary artery disease, atrial fibrillation, smoking status, and baseline NIHSS score. After full adjustment, hs‐cTnT remained associated with higher deep WMH grade. *P corr<0.05. CMB indicates cerebral microbleeds; DWM, deep white matter; hs‐cTnT, high‐sensitivity cardiac troponin T; NIHSS, National Institutes of Health Stroke Scale; PVS, perivascular spaces; PVWM, periventricular white matter; SVD, small vessel disease; and WMH, white matter hyperintensities.
