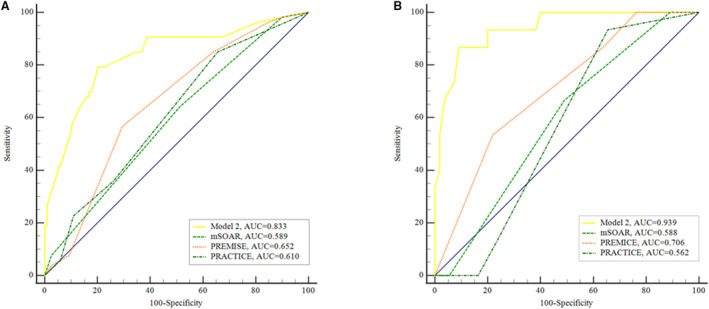
Figure 5. Comparison of different risk models using ROC curves.

The ROC curves in the training cohort (A) and validation cohort (B). AUC indicates area under the ROC curve; mSOAR, modified Stroke Subtype, Oxfordshire Community Stroke Project Classification, Age, and Prestroke Modified Rankin; PREMISE, Predicting Early Mortality From Ischemic Stroke; PRACTICE, Predicting 90 Days Mortality of Acute Ischemic Stroke With Mechanical Thrombectomy; and ROC, receiver operating characteristic.
