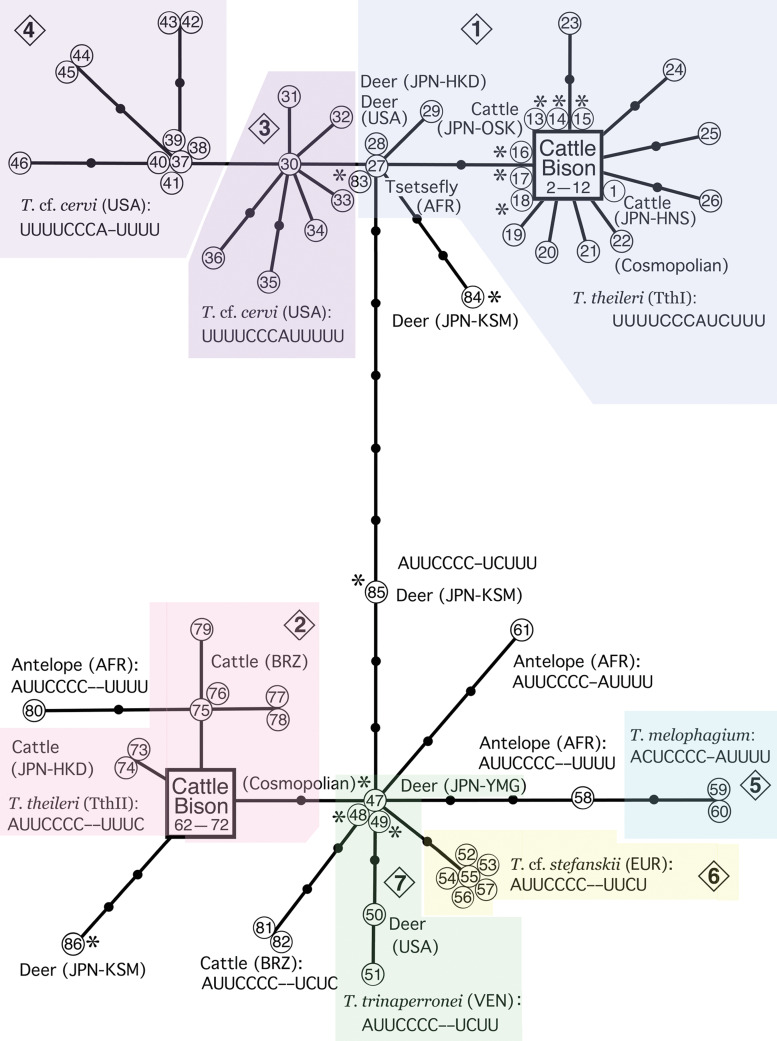
Fig. 4.
Relationships of ruminant Megatrypanum-type trypanosome isolates based on nucleotide sequence differences in the hypervariable region of 18S rDNA, illustrated via HapStar network analysis. Detailed data about the nucleotide sequences of analysed isolates are shown in Supplementary Table 1, and numbers in the circles or squares of this figure correspond to material numbers shown in Supplementary Table 2. Numbers 1–7 in the rhombus indicate genotypes shown in Fig. 3.

