Figure 2.
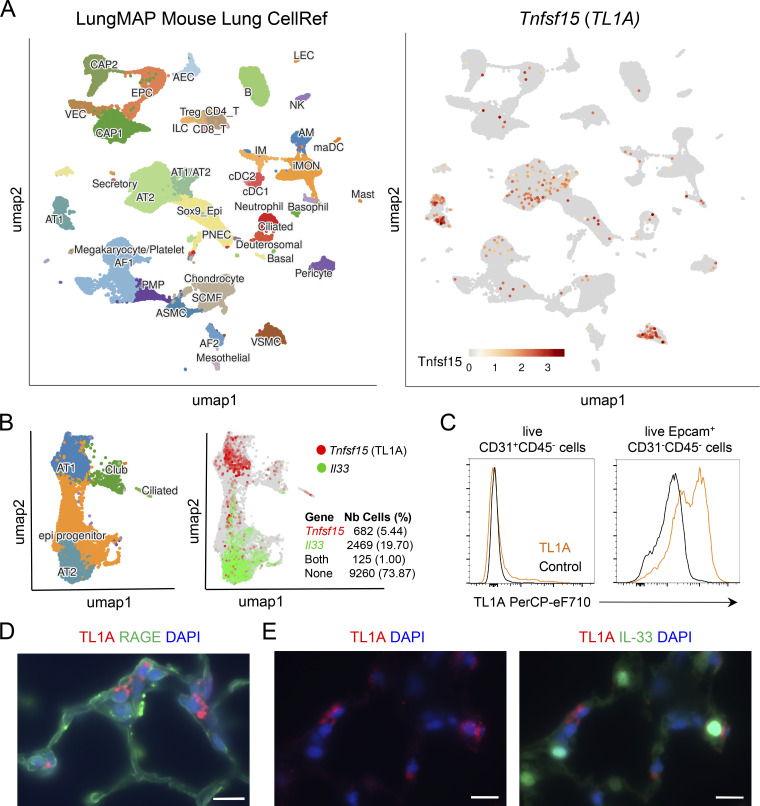
TL1A is expressed in mouse alveolar epithelium at steady state. (A) Visualization of Tnfsf15 (TL1A) expressing cells in the LungMAP single-cell mouse lung atlas. UMAP plots show the clustering of 95,658 lung cells (17 samples from late developmental stage to postnatal day 28). The different cell types in the lungs of naïve mice are indicated on the left. Results are visualized using ShinyCell (Ouyang et al., 2021) and are based upon data generated by the LungMAP Consortium (Guo et al., 2023) and downloaded from http://www.lungmap.net (Gaddis et al., 2024). (B) Single-cell RNA-seq analysis of Tnfsf15/TL1A and Il33 gene expression in mouse lung epithelium. UMAP plots show clustering and cell type annotation of 12,536 mouse lung epithelial cells (seven samples from the emergence of the alveolus to postnatal day 28) (Zepp et al., 2021). The number and percentage of epithelial cells expressing Tnfsf15/TL1A, Il33, or both are indicated on the right. Results are visualized using ShinyCell (Ouyang et al., 2021) and are based upon data obtained by Zepp et al. (2021) and downloaded from http://www.lungmap.net (Gaddis et al., 2024). (C) Flow cytometry analysis of cell surface TL1A expression on live CD31+CD45− endothelial cells and Epcam+CD31−CD45− epithelial cells in the lung of a naïve wild type C57BL/6J mouse at steady state. (D and E) Immunohistofluorescence staining of lung tissue sections (naïve wild type C57BL/6J mouse, steady state) with antibodies against TL1A (D and E) and RAGE (D) or IL-33 (E) proteins. A tyramide signal amplification (TSA)-based immunofluorescence method was used to detect TL1A-expressing cells in situ. Images are representative of two independent experiments. Scale bar, 10 μm.

