Figure 3.
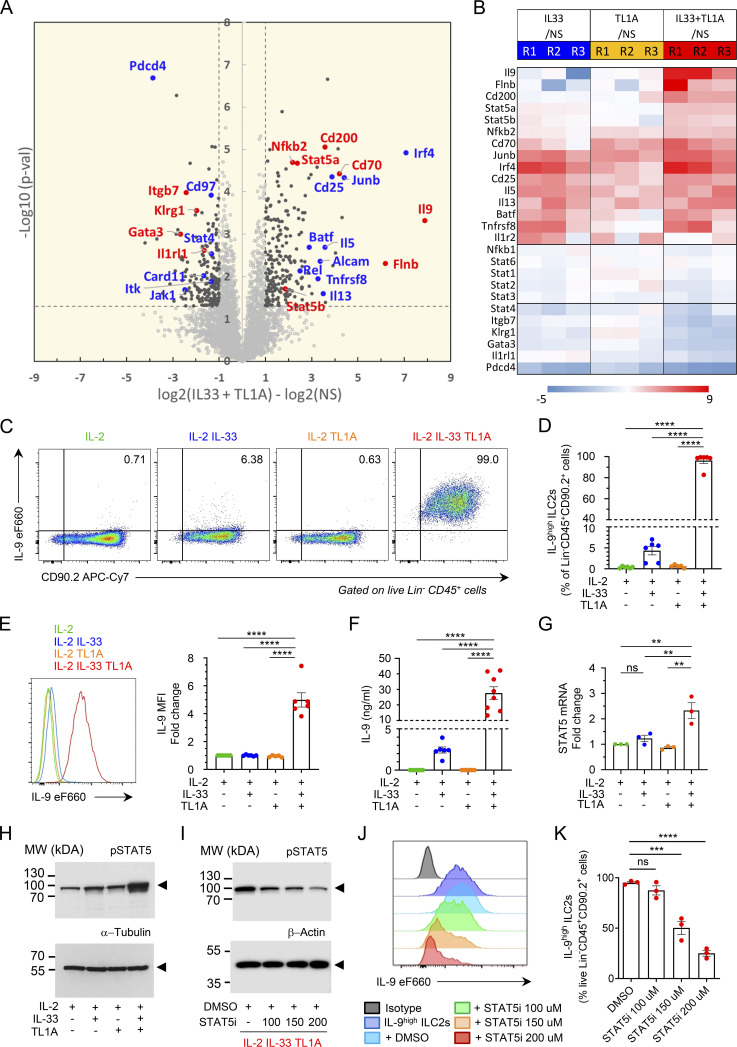
TL1A synergizes with IL-33 to induce an IL-9-producing ILC9 phenotype in lung ILC2s. (A and B) Large-scale label-free proteomic analyses of ILC2s isolated from pooled lungs of IL-33-treated Rag2−/− C57BL/6 J mice (Schmitt et al., 2018) and cultured with IL-2 (Fig. S2 A) prior to overnight stimulation with rIL-2 ± rIL-33 ± rTL1A. Volcano plot of IL-33/TL1A-stimulated ILC2s (ILC9 cells) compared with nonstimulated cells (NS; in culture with IL-2 alone) (A). Statistical analysis of protein abundance values was performed from different biological replicate experiments (n = 6 for NS; n = 3 for IL33/TL1A stimulation) using a Student’s t test (log10 P value, vertical axis). Proteins found as significantly over or under-expressed (P < 0.05 and abs[log2 fold change] >1) are shown in black. Examples of proteins modulated in both IL-33/TL1A-stimulated ILC2s and IL-33-stimulated ILC2s are shown in blue. Proteins shown in red are representative of molecules specifically modulated in IL-33/TL1A-stimulated ILC2s (A). Heat-map of fold changes of selected proteins in three independent biological replicates (B). (C–K) Analysis of ILC2s isolated from pooled lungs of IL-33-treated Rag2−/− C57BL/6 J mice (Schmitt et al., 2018), and cultured with IL-2 prior to 14 h stimulation with rIL-2 ± rIL-33 ± rTL1A. Flow cytometry analysis of live Lin− CD45+ cells (C, E, and J), frequency of IL-9high ILC2s (percentage of live Lin− CD45+ CD90.2+ cells) (D and K), and MFI fold change of IL-9 in ILC2s (E), after cytokines treatment and restimulation by PMA, ionomycin, and brefeldin A (4 h, C–E) or brefeldin A (4 h, J and K). Concentration of IL-9 secreted by ILC2s, measured by ELISA (F). Relative STAT5 mRNA expression levels measured by real-time qPCR (G). Samples were normalized to the expression of HPRT and are shown relative to IL-2-stimulated ILC2s. Immunoblot analysis of activated phosphorylated STAT5 (pSTAT5) and α-tubulin (H) or β-actin (I); Arrowheads indicate the migration of the protein of interest; cropped images. Cultured ILC2s were treated with rIL-2 + rIL-33 + rTL1A and increasing doses of a STAT5 inhibitor (STA5i, CAS 285986-31-4) or control vehicle (DMSO) (I–K). Numbers inside outlined areas (C) indicate percent of cells in the relevant gate. Each symbol represents an individual biological replicate (D–G and K). Data are pooled from six (D and E), six to eight (F) or three (G and K) independent experiments, or are representative of six (C and E) or three (H–J) independent experiments. Data are expressed as mean (±SEM) with P values determined by one-way ANOVA followed by Tukey’s multiple-comparisons test (D–G and K): ns not significant, ** P < 0.01, *** P < 0.001, **** P < 0.0001. Source data are available for this figure: SourceData F3.

