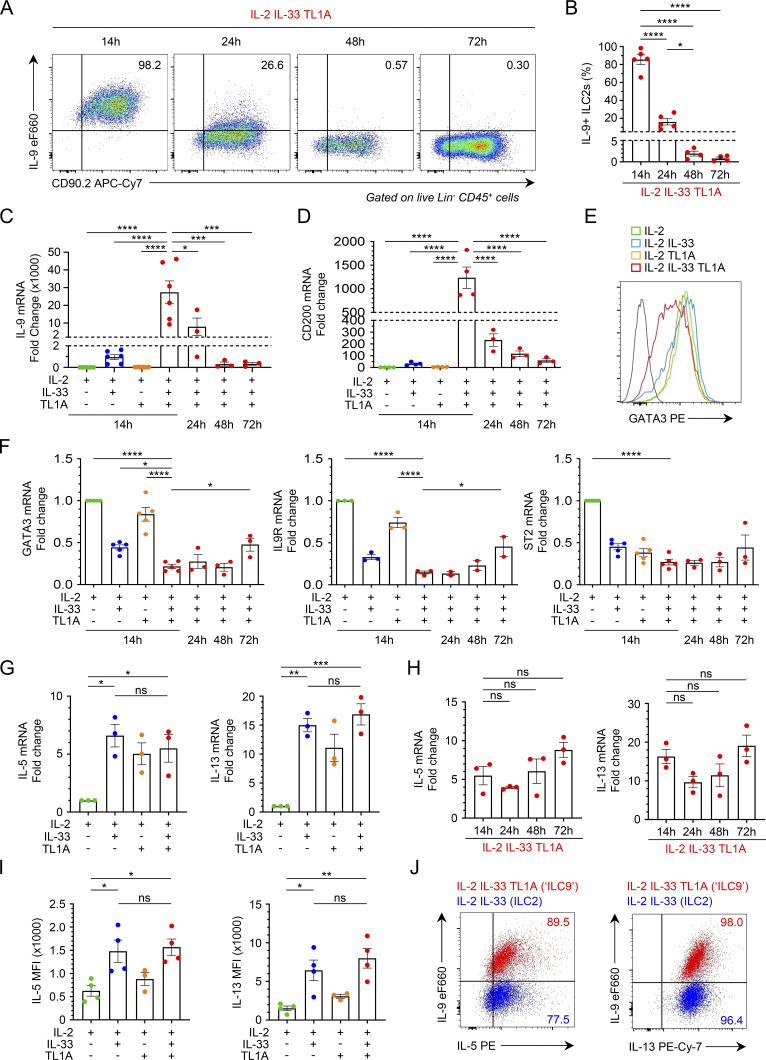
Figure 4.
The ILC9 phenotype corresponds to a transient IL-9highGATA3low multicytokine producing state of activated ILC2s. (A–J) Analysis of ILC2s isolated from pooled lungs of IL-33-treated Rag2−/− C57BL/6 J mice (Schmitt et al., 2018) and cultured with IL-2 prior to stimulation with rIL-2 ± rIL-33 ± rTL1A. The cells are stimulated for 14 h (E, G, I, and J), except for the kinetic experiments for which the stimulation time is indicated on the graph (A–D, F, and H). Flow cytometry analysis of IL-9, GATA3, IL-5, or IL-13 expression in cultured lung ILC2s (live Lin− CD45+ CD90.2+ cells) after cytokine treatment and incubation with brefeldin A (4 h), with (A) or without restimulation by PMA and ionomycin (E, I, and J). Numbers inside outlined areas indicate the percent of cells in the relevant gate and data are representative of two to three independent experiments. Frequency of IL-9high ILC2s (Lin− CD45+CD90.2+ cells) (B), MFI of IL-5 and IL-13 in ILC2s (I), and relative mRNA expression levels of IL-9 (C), CD200 (D), GATA3, IL9R, ST2 (IL1RL1) (F), IL-5 and IL-13 (G and H) by real-time qPCR, 14 h (G and I) or at different time points (B–D, F, and H) after stimulation of lung ILC2s. Samples were normalized to the expression of HPRT and are shown relative to IL-2-stimulated ILC2s (C, D, and F–H). Each symbol (B–D and F–I) represents an individual biological replicate from two to six independent experiments. Data are expressed as mean (±SEM) with P values determined by one-way ANOVA followed by Tukey’s multiple-comparisons test (B–D and F–I): ns, not significant, * P < 0.05, ** P < 0.01, *** P < 0.001, **** P < 0.0001.

