Figure 5.
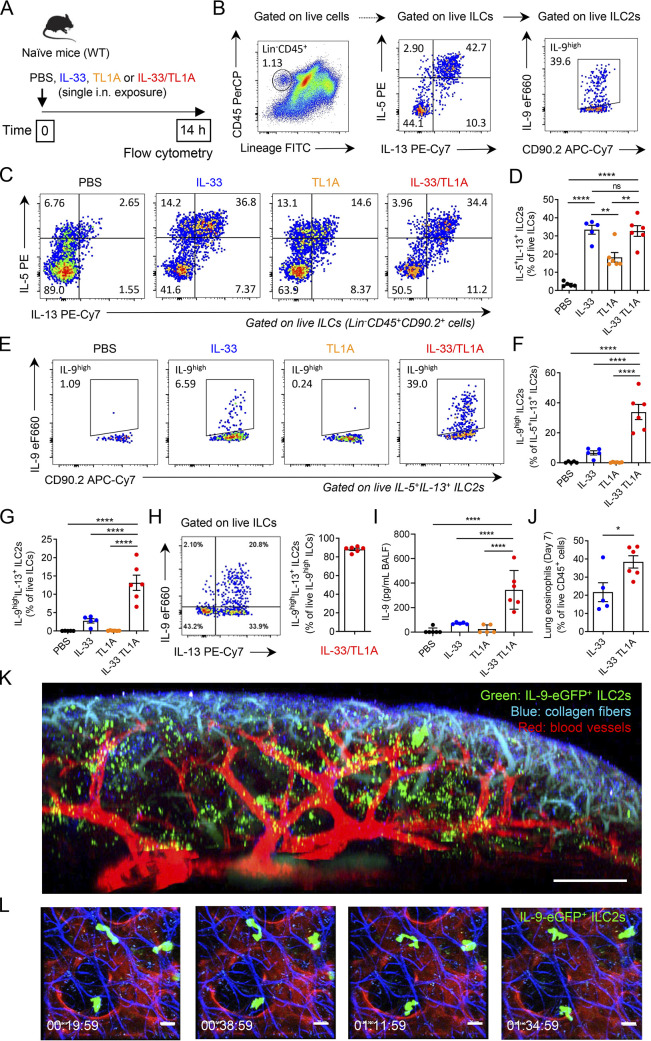
TL1A cooperates with IL-33 for induction of IL-9high ILC2s in vivo. (A) Treatment schedule of naïve wild type (WT, C57BL/6J) mice. (B) Gating strategy of IL-9high IL-5+IL-13+ ILC2s. (C–I) Flow cytometry of IL-5+IL-13+ ILC2s gated on live ILCs (Lin−CD45+CD90.2+ cells) (C) and IL-9high ILC2s gated on live IL-5+IL-13+ ILC2s (E), frequency of lung IL-5+IL-13+ ILC2s among live ILCs (D), IL-9high ILC2s among live IL-5+IL-13+ ILC2s (F), and IL-9highIL-13+ ILC2s among live ILCs (G) or IL-9high ILCs (H), and concentration of IL-9 in BAL fluids (ELISA assay, I) of WT mice 14 h after a single i.n. administration of PBS or rIL-33 (1 μg) and/or rTL1A (5 μg). Numbers inside outlined areas indicate the percent of cells in the relevant gate and data are representative of two independent experiments (C and E). Each symbol represents an individual mouse and data are pooled from two independent experiments. Data are expressed as mean (±SEM) with P values determined by one-way ANOVA followed by Tukey’s (D) or Dunnett’s (F, G, and I) multiple-comparisons tests: ns, not significant, ** P < 0.01, **** P < 0.0001. (J) Frequency of lung eosinophils (Gr1lowSiglec-F+CD11c− cells) among live CD45+ cells, at day 7 after a single i.n. exposure to rIL-33 or rIL-33 plus rTL1A. Each symbol represents an individual mouse and data are pooled from two independent experiments. Data are expressed as mean (±SEM) with P values determined by unpaired two-tailed Student’s t test: * P < 0.05. (K and L) Multiphoton imaging (K) and intravital microscopy (L) of whole lungs of INFER IL-9 fluorescent reporter mice, with detection of IL-9-eGFP+ ILC2s (green) and staining of blood vessels (red) and collagen fibers (blue), 16–18 h after a single i.n. administration of IL-33/TL1A combination (1 μg rIL-33 plus 5 μg rTL1A). To increase the numbers of lung IL-9high ILC2s accessible to in vivo imaging, the single i.n. exposure to IL-33/TL1A combination was performed after prior expansion of lung ILC2s by repeated i.p. injections of IL-33 (K and L). Multiphoton image (K) is a 3D reconstitution of stitched images (7 × 7 tiles and 181 z-stack). Time-lapse images (L) illustrate the migratory behavior of IL-9-eGFP+ ILC2s. Time in h/min/s. Scale bars: K, 300 μm; L, 20 μm.

