Figure 6.
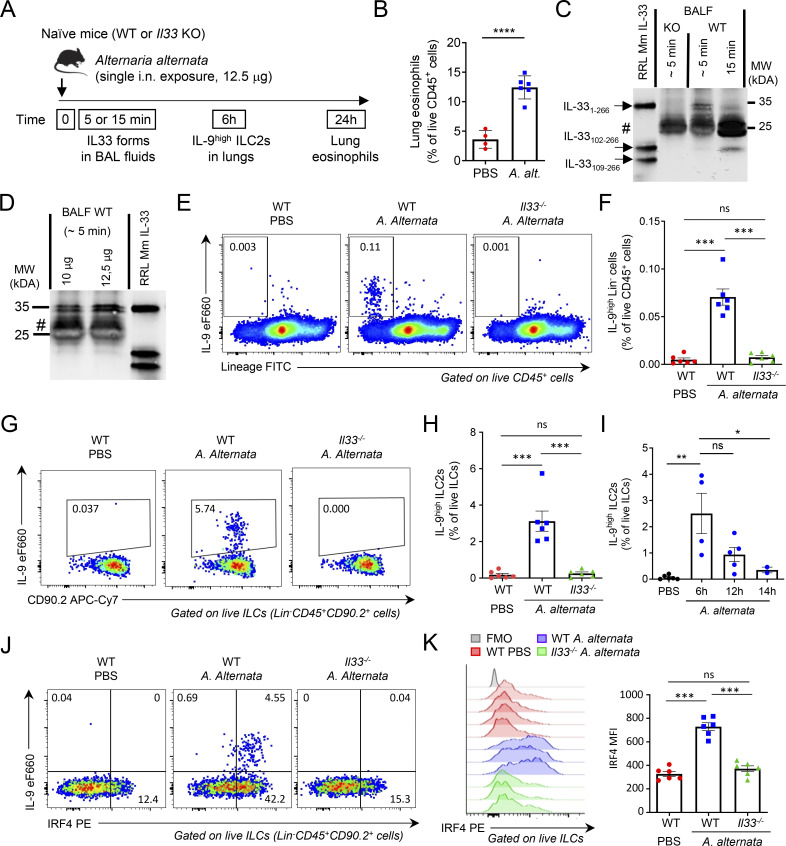
Endogenous IL-33 is essential for the induction of IL-9high ILC2s during the initiation of allergic airway inflammation. (A) Treatment schedule of naïve wild type (WT, C57BL/6J) and Il33−/− (KO, C57BL/6J) mice. (B) Frequency of eosinophils (among live CD45+ cells) in the lungs of WT mice 24 h after treatment with a single dose (12.5 μg) of A. alternata. (C and D) IL-33 forms in BAL fluids from KO mice and WT littermates were analyzed by pull-down assays with ST2-Fc followed by immunoblot with anti-mouse IL-33 antibodies. Recombinant full-length IL-33 (IL-331–266), IL-33102–266, and IL-33109–266 murine proteins were used as controls in the assays. Naïve mice were exposed to a single i.n. dose of A. alternata extracts using different times of exposure (C, 12.5 μg of A. alternata) or different amounts of the allergen (D). #, non-specific bands. Blots are representative of two independent experiments. (E–H) Flow cytometry and frequency of IL-9highLin− cells among live CD45+ cells (E and F) and IL-9high ILC2s among live ILCs (Lin−CD45+CD90.2+ cells) (G and H) in the lungs of WT (Charles River) or Il33 KO mice 6 h after a single i.n. exposure to A. alternata. (I) Frequency of IL-9high ILC2s among live ILCs (Lin−CD45+CD90.2+ cells) in the lungs of WT mice at different time points after a single allergen exposure. (J and K) Flow cytometry analysis of IL-9 and IRF4 expression in ILC2s (J) and MFI of IRF4 in ILC2s (K) in the lungs of WT (Charles River) or Il33 KO mice 6 h after a single allergen exposure. Numbers inside outlined areas indicate the percent of cells in the relevant gate (E, G, and J), and data are representative of two independent experiments (mice per group: n = 6). Each symbol represents an individual mouse (B, F, H, I, and K) and data are pooled from two (B, F, H, and K) or three (I) independent experiments. Data are expressed as mean (±SEM) with P values determined by unpaired two-tailed Student’s t test (B) or one-way ANOVA followed by Tukey’s multiple-comparisons test (F, H, I, and K): ns, not significant, * P < 0.05, ** P < 0.01, *** P < 0.001, **** P < 0.0001. Source data are available for this figure: SourceData F6.

