Figure 7.
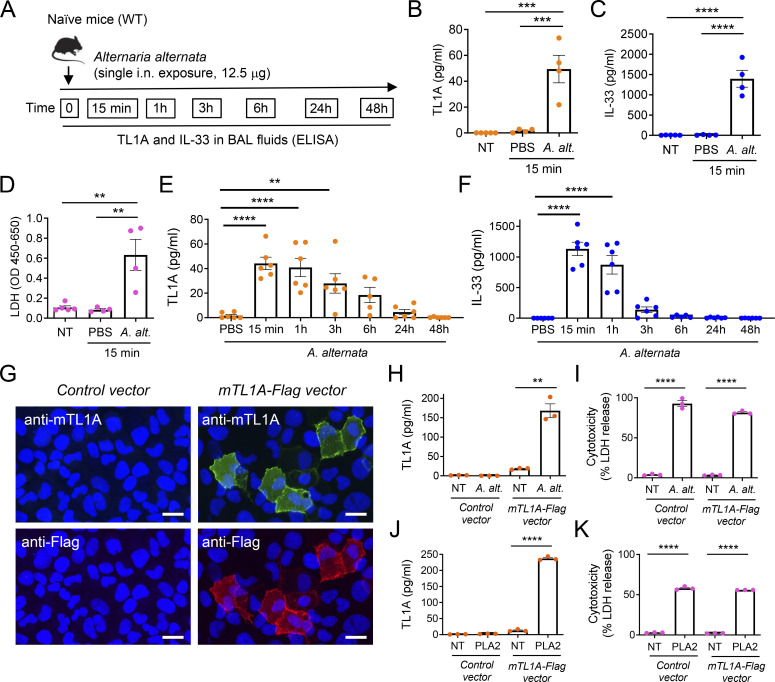
Endogenous TL1A functions as an epithelial alarmin rapidly released after allergen exposure. (A) Treatment schedule of naïve wild type (WT, C57BL/6J) mice. (B–F) Analysis of TL1A and IL-33 release in BAL fluids after a single allergen exposure. TL1A (B and E), IL-33 (C and F), and LDH (D) levels in BAL fluids were determined by ELISA (B, C, E, and F) or LDH (D) assays, 15 min (B–D) or at different time points (E and F) after a single i.n. administration of A. alternata extract (12.5 μg). Each symbol represents an individual mouse and data are pooled from two independent experiments (B–F). Data are expressed as mean (±SEM) with P values determined by one-way ANOVA followed by Tukey’s (B–D) or Dunnett’s (E and F) multiple-comparisons tests: ** P < 0.01, *** P < 0.001, **** P < 0.0001. (G–K) Analysis of TL1A release in cell supernatants after exposure of TL1A-expressing cells to A. alternata or bee venom phospholipase A2 (PLA2). U2OS epithelial cells transfected with a mouse TL1A-Flag expression vector (mTL1A-Flag vector) or control vector were analyzed by indirect immunofluorescence microscopy with anti-mTL1A and anti-Flag antibodies (G). Scale bar, 20 μm. TL1A (H and J) and LDH (I and K) levels in cell supernatants were determined by ELISA (H and J) or LDH cytotoxicity assays (I and K) 15 min after treatment with A. alternata extract (A. alternata, H and I) or 1 h after treatment with bee venom PLA2 (J and K). NT, not treated. Each symbol represents an individual biological replicate and data are pooled from three independent experiments (H–K). Data are expressed as mean (±SEM) with P values determined by unpaired two-tailed Student’s t tests (treatment versus NT): ** P < 0.01, **** P < 0.0001.

