Figure 9.
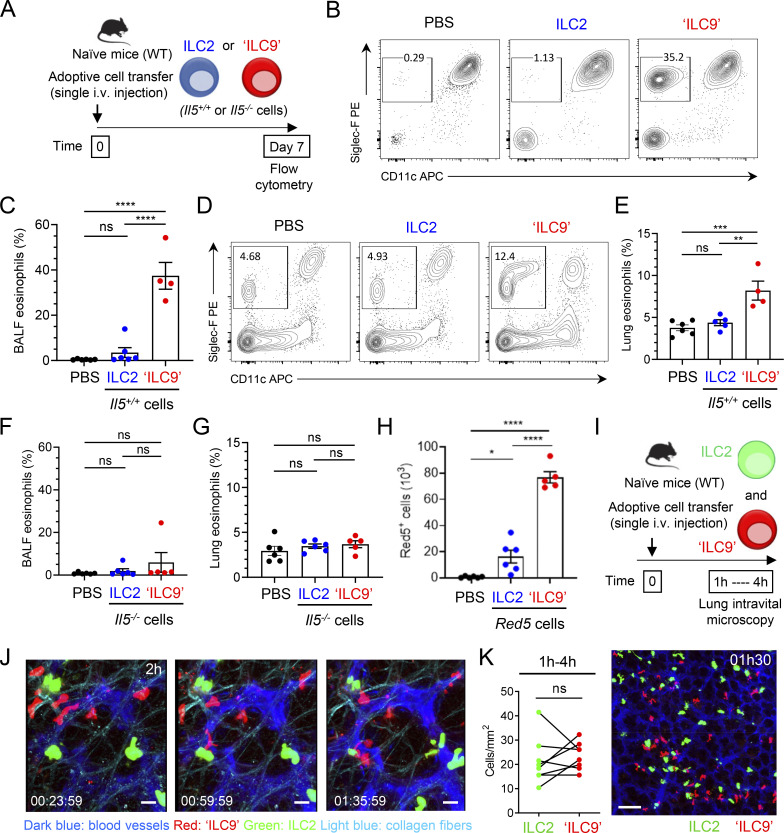
ILC9 cells have an increased capacity to initiate IL-5-dependent allergic airway inflammation. (A) Treatment schedule of naïve wild type (WT, C57BL/6J) mice by a single i.v. adoptive cell transfer of classical IL-33-activated ILC2s (ILC2) or IL-33/TL1A-activated ILC2s (ILC9). (B–H) Flow cytometry (B and D) and frequency of eosinophils (Gr1lowSiglec-F+CD11c− cells) among live CD45+ cells from BALF (C and F) or lung (E and G), and number of Red5+ ILC2s or ILC9s in total lung of mice (H), at day 7 after a single i.v. adoptive transfer of 5 × 10⁵ ILC2s or ILC9s in separate host mice. Adoptively transferred ILC2s and ILC9s were prepared from Rag2−/− mice (Il5+/+ cells) (B–E) or Red5 mice (Il5−/− cells) (F–H). Control mice received an intravenous injection of PBS. Red5+ cells indicate the activity of the Il5 promoter. Each symbol represents an individual mouse and data are representative (B and D) or pooled (C and E–H) from two independent experiments. (I–K) Live imaging of ILC2s and ILC9 cells in the lung. Lung intravital microscopy was performed 1–4 h after adoptive transfer of 6 × 10⁵ of each cell type in the same host (green, classical IL-33-activated ILC2s-CFSE+; red, IL-33/TL1A-activated ILC9 cells-CTO+) (I). Imaging of the migratory behavior of ILC2s and ILC9 cells in the lung (J) and cell quantification from lung intravital microscopy data (K). Time-lapse images, 2 h after adoptive cell transfer (J). A maximum intensity projection of stitched images (2 × 2 tiles and 18 z-stack) is shown (K). Time in h/min/s. Scale bars: J, 20 μm; K, 100 μm. Lung intravital microscopy data are representative (J and K) or analyzed (K) from three adoptive transfer experiments on four mice. Data are expressed as mean (±SEM) with P values determined by paired two-tailed Student’s t test (K) or one-way ANOVA followed by Tukey’s multiple-comparisons test (C and E–H): ns, not significant, * P < 0.05, ** P < 0.01, *** P < 0.001, **** P < 0.0001.

