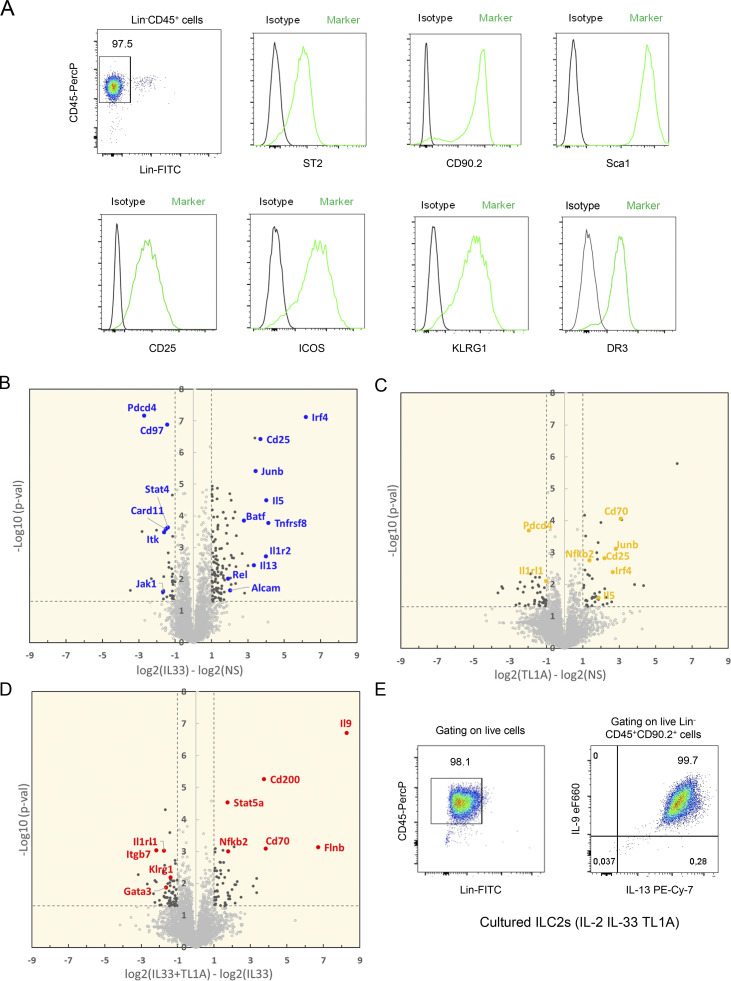
Figure S2.
High throughput proteomic analyses of lung ILC2s stimulated ex vivo with IL-33 and/or TL1A. (A) Flow cytometry of cultured lung ILC2s ex vivo. Representative histograms of ST2, CD90.2, Sca-1, CD25, ICOS, KLRG1, and DR3 expression at the surface of cultured ILC2s, 3 days after ILC2 cell isolation from the lung and ex vivo culture in the presence of IL-2. Phenotypic analysis was performed on live Lin–CD45+ cells. (B–D) Large-scale label-free proteomic analyses of mouse lung ILC2s after ex vivo overnight stimulation with rIL-2 ± rIL-33 ± rTL1A. Volcano plots of IL-33-stimulated ILC2s (B) or TL1A-stimulated ILC2s (C) compared with non-stimulated cells (NS; in culture with IL-2 alone). Volcano plot of IL-33/TL1A-stimulated ILC2s compared to IL-33-stimulated cells (D). Statistical analysis of protein abundance values was performed from different biological replicate experiments (n = 6 for NS and IL33 stimulation; n = 3 for TL1A and IL33/TL1A stimulations), using a Student’s t test (log10 P value, vertical axis). Proteins found as significantly over or under-expressed (P < 0.05 and abs[log2 fold change] >1) are shown in black. Representative examples of proteins found modulated in each comparison are shown in color. (E) Flow cytometry of cultured lung ILC2s after 14 h of co-stimulation with IL-33 and TL1A in the presence of IL-2 (ILC2 culture used in Fig. 3 C). Intracellular cytokine staining revealed that >99% of ILC2s co-expressed IL-9 and IL-13 intracellularly. Phenotypic analysis was performed on live Lin−CD45+CD90.2+ cells.

