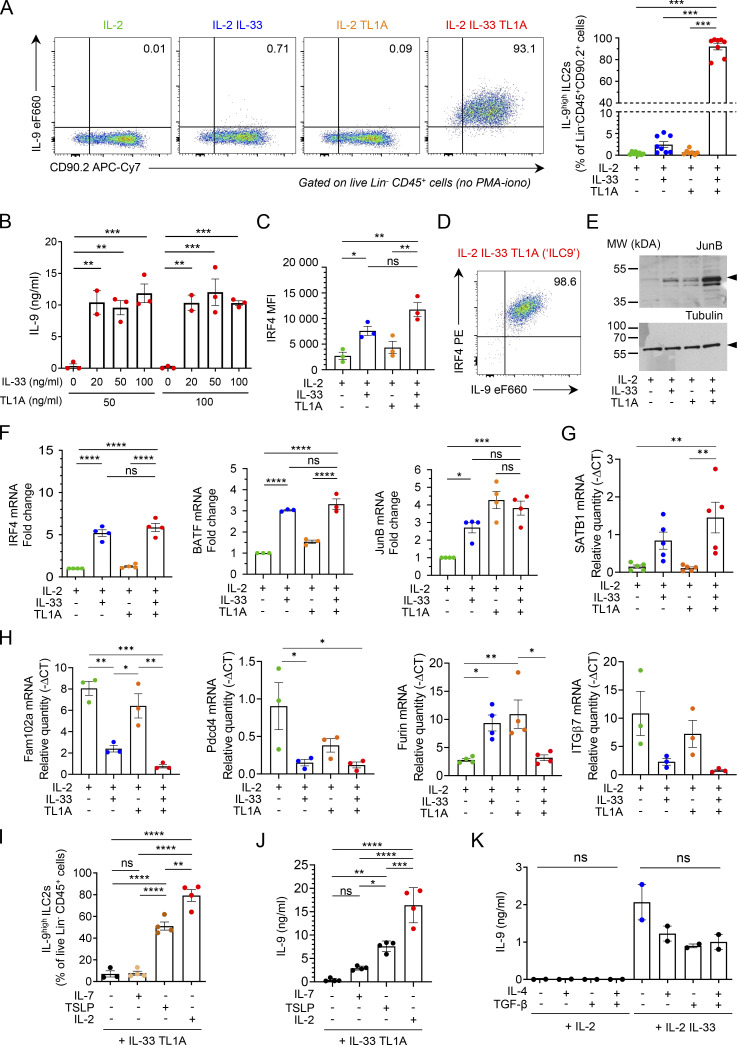
Figure S3.
IL-33 and TL1A synergistically induce IL-9-producing ILC2s ex vivo. (A) Analysis of cultured lung ILC2s 14 h after ex vivo stimulation by rIL-2 (20 ng/ml) ± rIL-33 (20 ng/ml) ± rTL1A (50 ng/ml). Flow cytometry analysis of live Lin− CD45+ cells and frequency of IL-9high ILC2s (percentage of live Lin− CD45+ CD90.2+ cells) after cytokine treatment and incubation with brefeldin A (4 h), without restimulation by PMA and ionomycin. Numbers inside outlined area indicate percent of cells in the relevant gate and data are representative of eight independent experiments. (B) Concentration of IL-9 secreted by ILC2s treated with rIL-2 (20 ng/ml) and various concentrations of rIL-33 and rTL1A measured by ELISA. (C and D) MFI of nuclear factor IRF4 (C) and flow cytometry (D) of ILC2s 14 h after ex vivo stimulation of cultured ILC2s by rIL-2 (20 ng/ml) ± rIL-33 (20 ng/ml) ± rTL1A (50 ng/ml). Numbers inside outlined areas (D) indicate percent of cells in the relevant gate and data are representative of three independent experiments. (E) Immunoblot analysis of JunB and α-tubulin14 h after cytokine stimulation of lung ILC2s; Arrowheads indicate the migration of the protein of interest; cropped image. Data are representative of three independent experiments. (F–H) Relative mRNA expression levels by real time qPCR, 14 h after cytokine stimulation of lung ILC2s. Samples were normalized to the expression of HPRT and data are expressed relative to IL-2-stimulated ILC2s (F) or relative to HPRT mRNA quantity (G and H). (I and J) Analysis of mouse lung ILC2s 14 h after ex vivo stimulation by rIL-33 + rTL1A ± rIL-2 ± rIL-7 ± rTSLP. Frequency of IL-9high ILC2s (Lin− CD45+ CD90.2+ cells), after cytokines treatment and re-stimulation by PMA, ionomycin and brefeldin A (4 h, I). Concentration of IL-9 secreted by ILC2s, measured by ELISA (J). (K) Concentration of IL-9 (ELISA) secreted by ILC2s 14 h after ex vivo stimulation by rIL-2 ± rIL-33 ± rIL-4 ± rTGF-β. Each symbol represents an individual biological replicates with n = 2–5 independent experiments (A–C and F–K). Data are expressed as mean (±SEM) with P values determined by one-way ANOVA followed by Tukey’s (A, C, and F–J) or Dunnett’s (B and K) multiple-comparisons tests: ns, not significant, * P < 0.05, ** P < 0.01, *** P < 0.001, **** P < 0.0001. In H, all significant P values are annotated with stars, all other comparisons are not significant. Source data are available for this figure: SourceData FS3.

