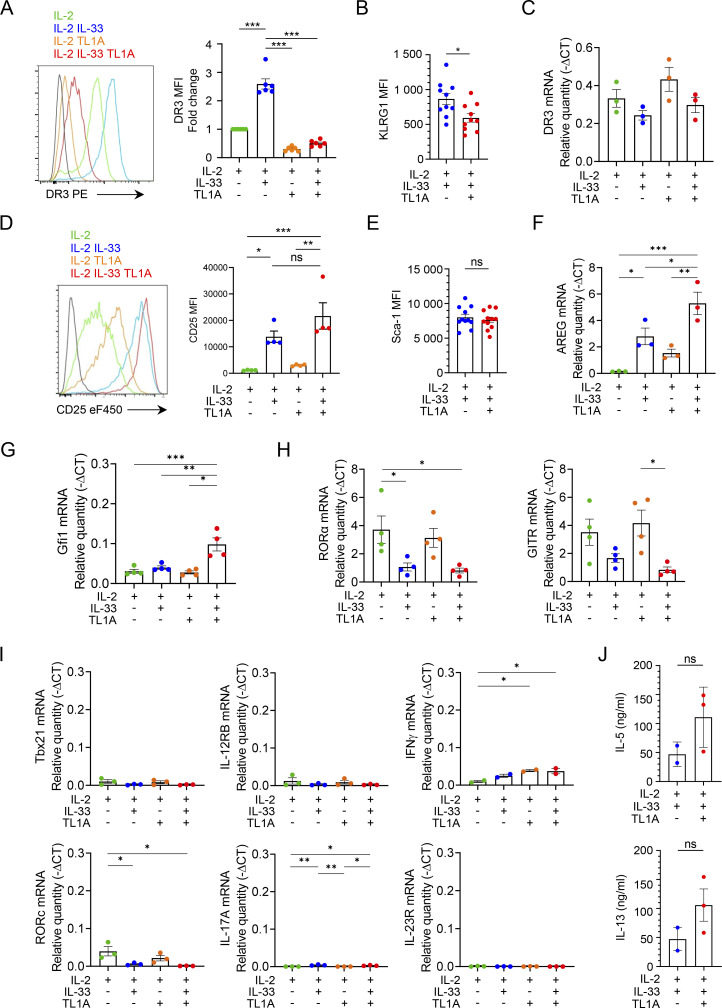
Figure S4.
IL-33 and TL1A induce phenotypic changes in cultured lung ILC2s at the protein and mRNA levels. (A–J) Analysis of mouse lung ILC2s 14 h after ex vivo stimulation by rIL-2 ± rIL-33 ± rTL1A. MFI of the indicated cell surface markers determined by flow cytometry (A, B, D, and E). Relative mRNA expression levels of various genes (C and F–I), including genes characteristic of ILC1s or ILC3s (I), determined by real-time qPCR, 14 h after cytokine stimulation of lung ILC2s. Samples were normalized to the expression of HPRT and data are expressed as relative to HPRT mRNA quantity. Concentration of IL-5 or IL-13 in cell supernatants, measured by ELISA assay (J). Each symbol represents an individual biological replicate from independent experiments (A–J). Data are expressed as mean (±SEM) with P values determined by unpaired two-tailed Student’s t test (B, E, and J) or one-way ANOVA followed by Tukey’s multiple-comparisons test (A, C, D, and F–I): ns, not significant, * P < 0.05, ** P < 0.01, *** P < 0.001. In I, all significant P values are annotated with stars, all other comparisons are not significant.

