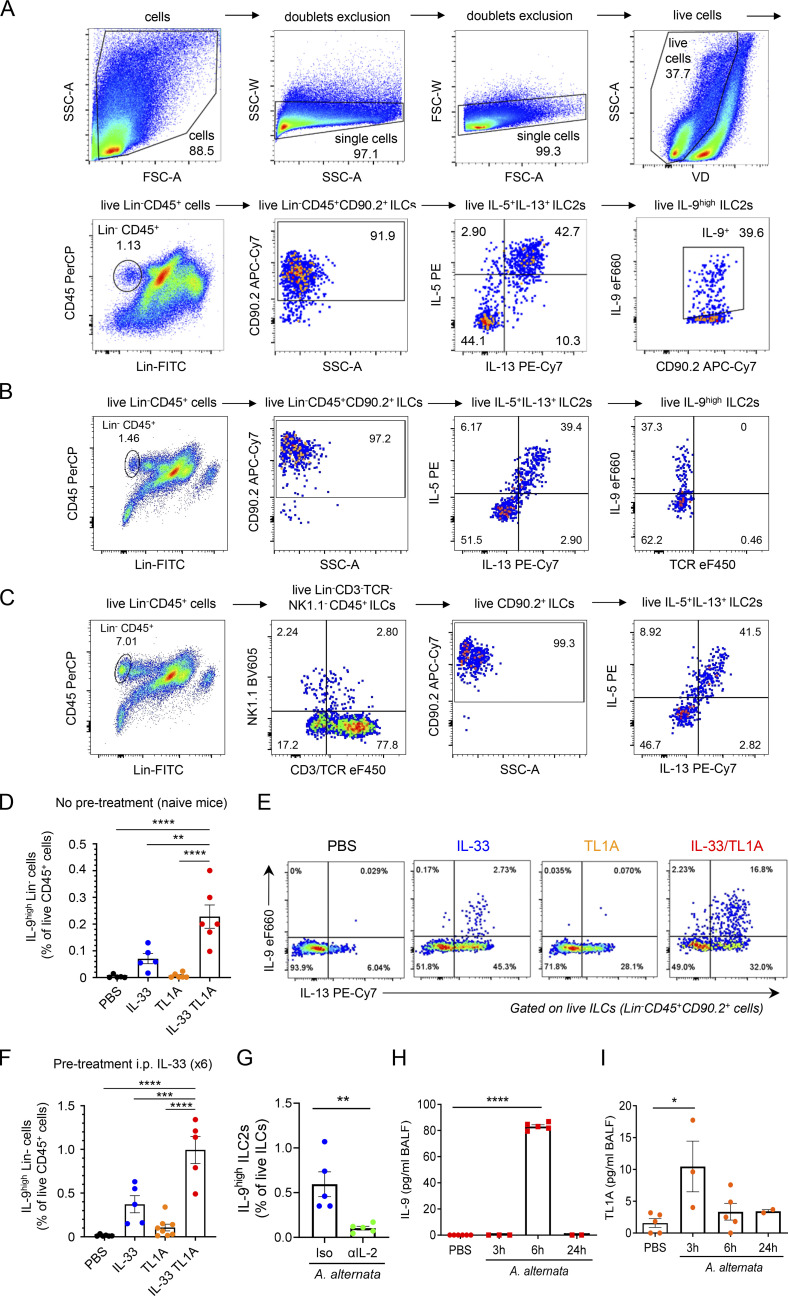
Figure S5.
IL-33 and TL1A synergistically induce IL-9-producing ILC2s in vivo. (A) Gating strategy and representative flow cytometry plots of live lung ILCs (live Lin−CD45+CD90.2+ cells), live lung IL-5+IL-13+ ILC2s (live IL-5+IL-13+ ILCs) and live lung IL-9high ILC2s (live IL-9high IL-5+IL-13+ ILC2s) in vivo in wild type (WT) C57BL/6J mouse, 14 h after a single i.n. administration of rIL-33 (1 μg) and rTL1A (5 μg). (B) Verification of the absence of contamination of the IL-5+IL-13+ ILC2s and IL-9high ILC2s populations by TCR+ cells (T cells and NKT cells) using anti-TCRβ and anti-TCRγδ antibodies. (C) Confirmation of the expression of IL-5 and IL-13 in live Lin−CD3/TCR−NK1.1−CD45+CD90.2+ lung ILCs using antibodies against CD3/TCR and NK1.1 with a different fluorescence from the Lin cocktail (CD4, CD19, CD45R, CD11b, CD11c, Ter119, Ly6G, FcεRI). (D and E) Frequency of lung IL-9highLin− cells among live CD45+ cells (D), and flow cytometry of IL-9highIL-13+ ILC2s (live IL-9highIL-13+Lin−CD45+CD90.2+ cells) (E) of WT mice 14 h after a single i.n. administration of PBS or rIL-33 (1 μg) and/or rTL1A (5 μg). Numbers inside outlined areas indicate the percent of cells in the relevant gate. (F) Frequency of lung IL-9highLin− cells among live CD45+ cells of WT mice pretreated with six daily i.p. injections of rIL-33 (days 1–6) prior to one i.n. injection of PBS or rIL-33 and/or rTL1A (day 7). Flow cytometry analyses were performed on day 8. (G) Frequency of IL-9high ILC2s among live ILCs (Lin−CD45+CD90.2+ cells) in the lungs of WT mice 6 h after a single i.n. administration of A. alternata extract (12.5 μg), with (αIL-2 mAb) or without (Iso, isotype control mAb) IL-2 blockade. (H and I) Analysis of IL-9 and TL1A release in BAL fluids by ELISA at different time points after the third exposure to A. alternata in a chronic exposure model (repeated i.n. administration of 12.5 μg A. alternata at days 0, 3, and 6). Each symbol represents an individual mouse and data are pooled from two (D and G) or three (F, H, and I) independent experiments. Data are expressed as mean (±SEM) with P values determined by unpaired two-tailed Student’s t tests (G) or one-way ANOVA followed by Dunnett’s multiple-comparison test (D, F, H, and I): * P < 0.05, ** P < 0.01, *** P < 0.001, **** P < 0.0001.

