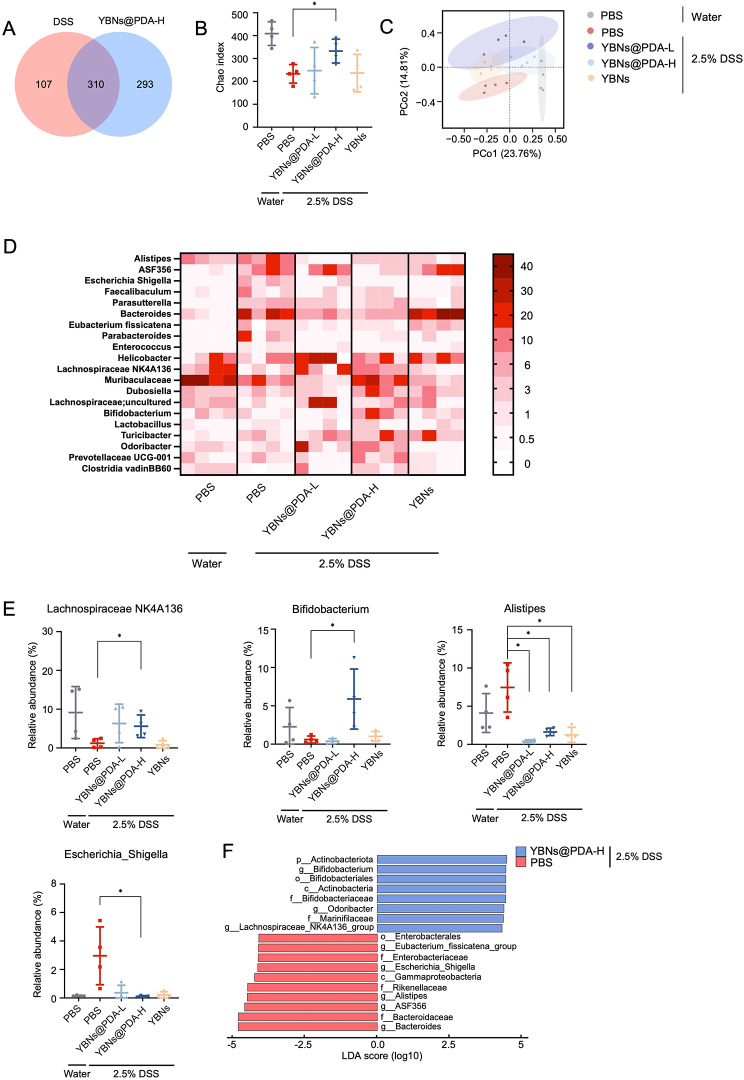
Fig. 6.
Gut microbiome composition changes with the treatment of YBNs and YBNs@PDA. (A) Venn diagram of shared and unique species. (B) Alpha diversity was displayed by Chao. (C) PCoA plot illustrating the β-diversity according to the Bray-Curtis method. (D) Heatmap of the relative abundance of gut microbiome at genus level. The abundance is shown as relative percentage. (E) Relative abundance of select taxa at genus level. (F) LEfSe analysis of gut microbiota. Data are presented as mean ± standard deviation from a representative experiment (n = 4). *P < 0.05, **P < 0.01, ***P < 0.001, analysed by two-tailed unpaired Student’s t-test

