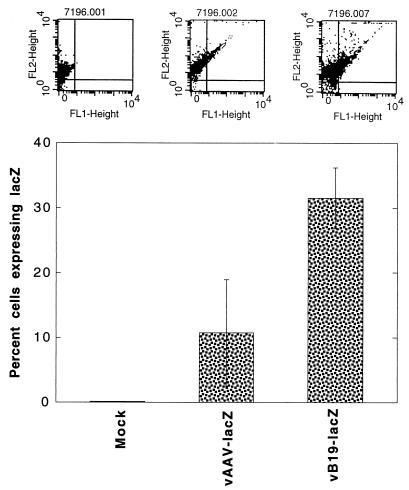
FIG. 4.
FACS analysis of lacZ gene expression in glycophorin A-positive primary human LDBM cells transduced with recombinant AAV- and B19-lacZ vectors. Glycophorin A-positive cells from human LDBM were either mock infected or infected with either 1 × 10⁵ particles of AAV-lacZ vector per cell or 2 × 10² particles of B19-lacZ vector per cell under identical conditions. Forty-eight hours postinfection, cells were harvested and processed for analysis of lacZ gene expression with fluorescent β-Gal product by using a Becton-Dickinson FACScan as described in Materials and Methods. The upper panels are FACS dot plots from a representative experiment indicating cells positive for lacZ (FL1-Height) and glycophorin A (FL2-Height). The results of dual positive cells from three separate experiments are plotted in the bar graph.

