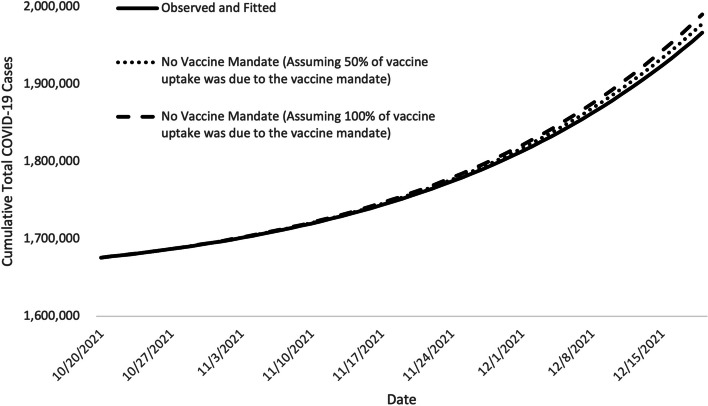
Fig. 2.
Fitted epidemic curves of COVID-19 case counts showing the impact of the vaccinate-or-test requirement
Notes: Fitted epidemic curve of observed COVID-19 case counts and of two assumed increases in vaccination coverage attributable to the announcement of the vaccinate-or-test requirement (for October 20 – December 20, 2021). These represent approximately 51,580 and 103,160 individuals vaccinated because of the vaccinate-or-test requirement. The solid line is Illinois’s observed cumulative COVID-19 case counts, and the dashed and dotted lines are the simulated curves illustrating the cumulative total cases for scenarios where there would have been a lower vaccine uptake without the vaccinate-or-test requirement. The differences between the solid and dashed or dotted lines show the number of cases averted by the vaccinate-or-test requirement. All results assume that the effects of other nonpharmaceutical interventions (NPIs) were constant over the two months analyzed

