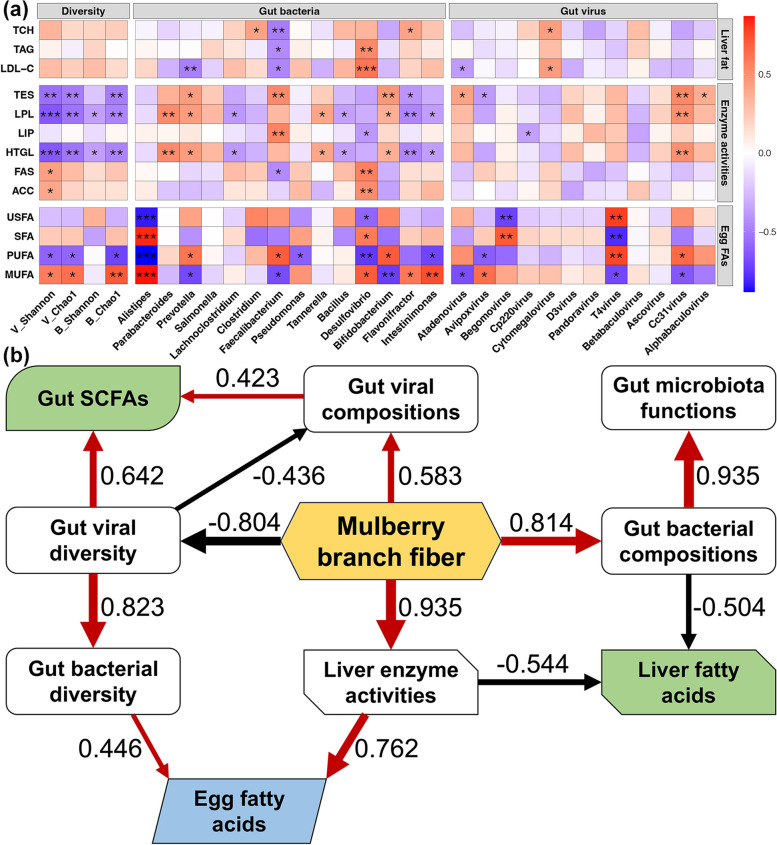
Fig. 7.
a Heatmap showing correlations of gut microbiota, lipid metabolism indicators and fatty acid composition of egg yolk. Color in each block represents the correlation coefficient. *, **, and *** represent the p value lower than 0.05, 0.01, and 0.001, respectively. b Partial least-squares path modeling showing the effects of dietary MF on the health state and egg quality of laying hens. Only paths with significant tests (p < 0.05) are shown in the plot. Positive and negative effects are shown by red and black lines, respectively. The line width was assigned according to the correlation coefficient

