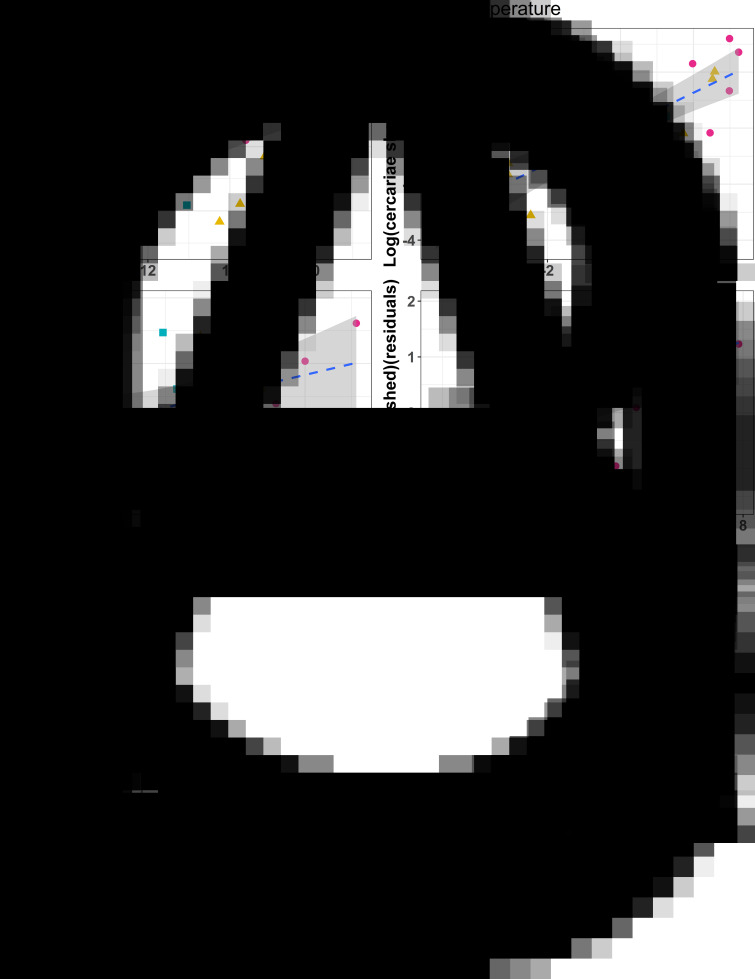
Fig. 2.
Relationship between mean temperature during each 3-week monitoring period and release of Rhipidocotyle fennica (A, B) and R. campanula (C, D) cercariae by Anodonta anatina mussels (2 study populations combined). The average cercariae release by mussels from different temperature treatments indicated with dot (high), triangle (intermediate) and square (low temperature). (A, C) ‘Raw’ data. (B, D) Residual plot accounting for the seasonality.

