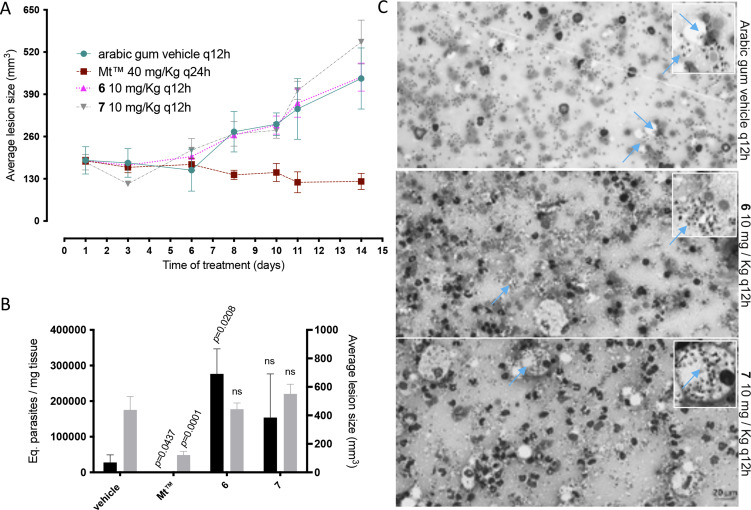
Fig. 2.
Effect of 6 and 7 in CL experimental mouse models using BALB/c mice infected with Leishmania amazonensis. The graphics show: average lesion size during treatment (A), the correlation between parasite load by qPCR (black bars) and average lesion size measurements (grey bars) at 31 dpi (B), according to each experimental group. Light microscopy of lesion imprints of infected mice treated with vehicle and after administration of compounds 6 and 7 at 10 mg kg−1 q12h po (C). Arrow: intracellular parasites. Statistical analysis was performed with GraphPad prism v.9.1.2 by ANOVA test (95% CI). When P value ⩾0.05 = not significant (ns).

