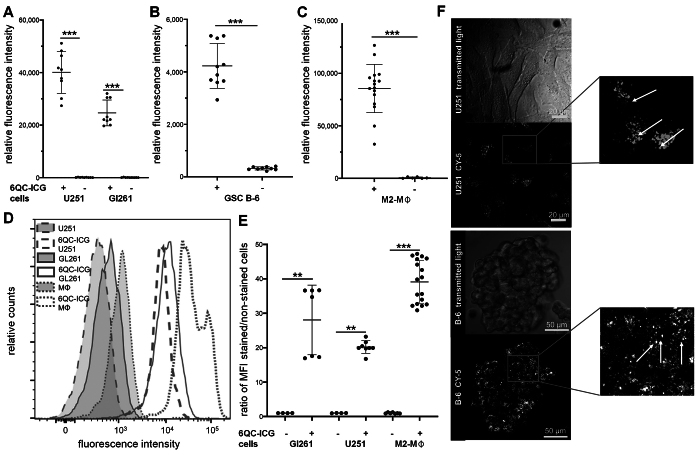
FIG. 1.
6QC-ICG is activated in glioma cells and tumor-associated macrophages. A–C: Fluorescence intensity in U251 and Gl261 glioma cell lines (A), glioma stem-like cells B-6 (B), and primary M2-polarized macrophages (M2-MΦ) (C) incubated with or without 1 µM 6QC-ICG for 6 hours. Fluorescence was measured in cell suspensions using spectrofluorimetry at ex/em 795/823 nm. Data are presented as mean ± SD from three independent experiments performed in triplicate. The horizontal lines represent the mean, the error bars the SD, and the dots the raw data. ***p < 0.001, Mann-Whitney U-test. D: Flow cytometry analysis (ex/em 640/783) of U251 and Gl261 glioma cell lines and primary M2-polarized macrophages incubated with or without 1 µM 6QC-ICG for 6 hours. E: The mean fluorescence intensity (MFI) ratio of stained to unstained cells was used to quantify the increase in fluorescence in individual cell lines; data are from two independent experiments performed at least in triplicate. ***p < 0.001, **p < 0.01, Mann-Whitney U-test. F: Representative images of U251 cells and a glioma stem-like cell B-6 spheroid incubated with 1 µM 6QC-Cy5 for 2 hours. White arrows show the fluorescence signal in granular vesicle-like structures.

