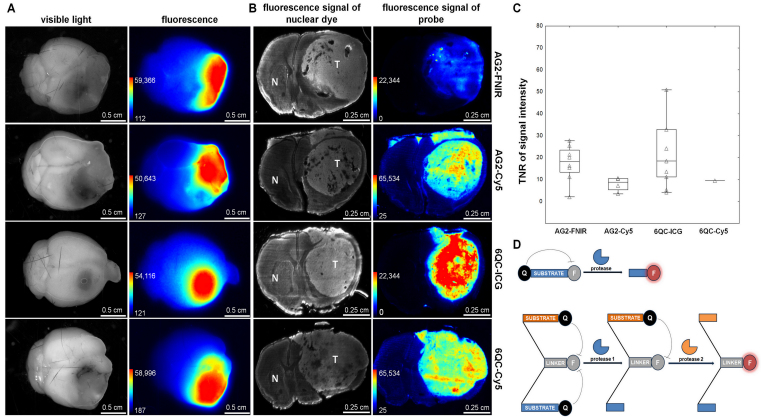
FIG. 2.
Activation of protease-activated substrate probes in an orthotopic GBM model. A: Images of brains with Gl261 tumors visualized using visible light (first column) and fluorescence (second column). The Xtreme imaging system was used to visualize fluorescence at ex/em 730/790 nm (AG2-FNIR and 6QC-ICG) and ex/em 630/700 nm (AG2-Cy5 and 6QC-Cy5). B: Fluorescence signals of the nuclear dye showing the location of Gl261 tumors in brain cryosections (first column) and the probes in corresponding brain cryosections (second column). C: Quantification of TNR for individual probes. The horizontal lines represent the median, the boxes the 25th to 75th percentile, the whiskers the nonoutlier range, and the triangles the raw data. Tumor-bearing mice were euthanized 24 hours after intravenous administration of 20 nmol of double-substrate probes AG2-FNIR and AG2-Cy5 (cysteine cathepsin and caspase 3 cleavable, AND-gate) and single-substrate probes 6QC-ICG and 6QC-Cy5 (cysteine cathepsin cleavable). The numbers of mice were as follows: 8 for AG2-FNIR, 9 for 6QC-ICG, 4 for AG2-Cy5, and 1 for 6QC-Cy5. Brains were extracted and 50-µm cryosections were prepared and imaged using ChemiDoc MP at ex/em 755–777/813–860 nm (AG2-FNIR and 6QC-ICG) and ex/em 625–650/675–725 nm (AG2-Cy5 and 6QC-Cy5). D: Schematic representation of single- and double-substrate probes. F = fluorophore; N = normal brain tissue; Q = quencher; T = tumor.

