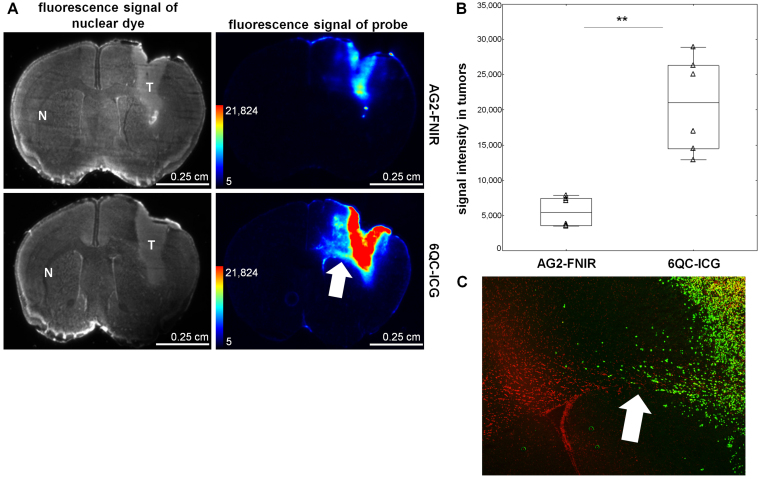
FIG. 3.
6QC-ICG shows a higher fluorescence signal intensity in the tumor than AG2-FNIR in orthotopic GBM models. A: Fluorescence signals of the nuclear dye showing the location of U251 tumors in brain cryosections (first column) and the probes in the corresponding brain cryosections (second column). B: Quantification of intratumoral fluorescence signal intensity. The horizontal lines represent the median, the boxes the 25th to 75th percentile, the whiskers the nonoutlier range, and the triangles the raw data. **p = 0.005, Mann-Whitney U-test. C: Microscopic image of a corresponding tissue section visualizing infiltrating human glioma cells (U251) stained with an anti–human nuclei antibody (green). Nuclear counterstaining is shown in red. Tumor-bearing mice were euthanized 24 hours after intravenous administration of 20 nmol of the probes (n = 6 sections from 2 mice for each probe). Brains were extracted, and several 10-µm cryosections were prepared and imaged simultaneously under the same conditions at ex/em 755–777/813–860 nm. Nuclei were stained with TO-PRO-3 (1 µM) and imaged at ex/em 625–650/675–725 nm. The arrows show tumor cells infiltrating the corpus callosum.

