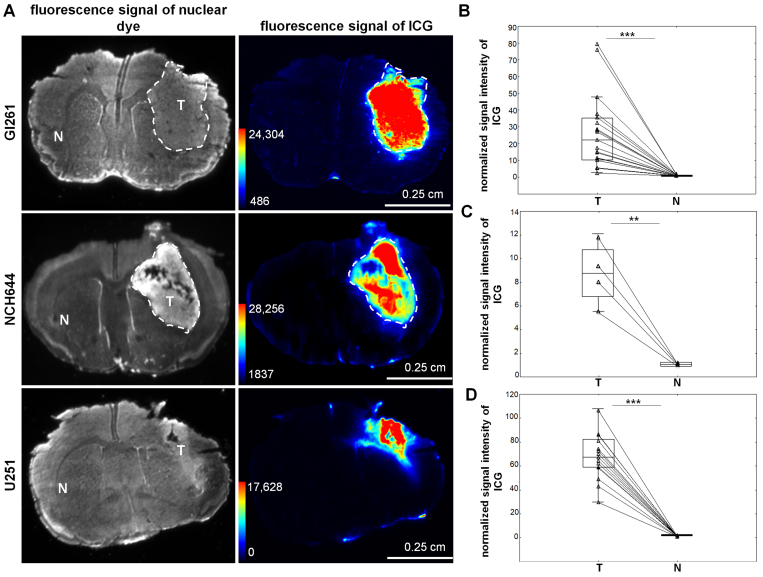
FIG. 4.
Activation of 6QC-ICG in Gl261 syngeneic, U251 xenotransplant, and NCH644 glioma stem-like cell mouse GBM models. A: Fluorescence signals of the nuclear dye, showing the location of the tumors in brain cryosections in Gl261, NCH644, and U251, respectively (first column), and the activated 6QC-ICG probe in brain cryosections (second column). B–D: Quantification of fluorescence signal in tumor and normal brain tissue in the contralateral hemisphere measured in Gl261 (B), NCH644 (C), and U251 (D) models. The fluorescence signal was normalized using the average fluorescence value in normal brain tissue in the contralateral hemisphere. The horizontal lines represent the median, the boxes the 25th to 75th percentile, the whiskers the nonoutlier range, and the triangles the raw data. ***p < 0.001, Wilcoxon signed-rank test, n = 19 and 15 mice from three independent experiments for the Gl261 and U251 models, respectively. **p < 0.01, paired t-test, n = 4 mice for NCH644 from one experiment. The white dashed line delineates the tumor. Nuclei were stained with TO-PRO-3 (1 µM) and imaged at ex/em 625–650/675–725 nm.

