Abstract
Synchrotron X-ray microbeam diffraction was used to measure the full elastic long range internal strain and stress tensors of low dislocation density regions within the submicrometer grain/subgrain structure of equal-channel angular pressed (ECAP) AA1050 after 1, 2, and 8 passes. This is the first time that full tensors were measured in plastically deformed metals at this length scale. This work supplements previous studies that measured long range internal stresses (LRIS) in ECAP AA1050 of multiple passes, but only for a single direction. The maximum (most tensile or least compressive) principal elastic strain directions for the unloaded 1 pass sample for the grain/subgrain interiors align well with the pressing direction, and are more random for the 2 and 8 pass samples. The measurements reported here indicate that the local stresses and strains become increasingly isotropic (homogenized) with increasing ECAP passes using route BC. The average maximum (in magnitude) LRISs are −0.43 σa for 1 pass, −0.44 σa for 2 pass, and 0.14 σa for the 8 pass sample. These LRISs appear to be larger than LRISs reported by previous works (using single reflection measurements).
Introduction
Severe plastic deformation (SPD) is a common method used for grain refinement. One of the more popular SPD techniques is equal channel angular pressing (ECAP) due to its ability to produce relatively homogeneous grain sizes in deformed bulk material [1–3]. The grain refinement process in ECAP occurs mostly [4] through the formation of geometrically necessary boundaries (GNBs). These boundaries have many emanating or extrinsic dislocations and may not be in equilibrium. There is direct evidence from transmission electron microscopy (TEM) for the presence of these extrinsic dislocations in aluminum alloys processed by ECAP [5]. Thus, GNBs maybe the source for the long range internal stresses (LRISs) observed by Alhajeri et. al. [6] in close proximity (20 nm) to the grain/subgrain boundaries of commercial-purity aluminum (AA1050) processed by ECAP. The elastic strains observed by Alhajeri were measured using convergent-beam electron diffraction (CBED) with a beam diameter of ≈ 20 nm. The principal stresses near the boundaries were measured to be about 112 MPa, or roughly 0.75 of the flow stress. Later works by the authors used synchrotron X-ray microbeam diffraction to examine the LRISs within the grain/subgrain interiors along the pressing and +22.5° off-axis directions (using a single reflection) for ECAP AA1050 after 1, 2, 4, and 8 passes [7, 8]. It was found that the results were consistent with the composite model. The composite model by Mughrabi [9] describes a plastically deformed metal as being a composite of “hard” and “soft” regions. “Hard” regions have high dislocation density (e.g. cell walls) and “soft” regions have low dislocation density (e.g. cell interiors). As the composite is compatibly strained, this creates regions of high and low stresses. The model was originally described for uniaxial multiple slip of an fcc Cu single crystal.
In this study, the full elastic strain and stress tensor measurements of the LRIS in ECAP AA1050 are presented as a continuation of earlier works [7, 8] by the authors. Full elastic strain/stress tensors from low dislocation density areas within ECAP AA1050 after 1, 2, and 8 passes were measured using synchrotron X-ray microbeam diffraction at beam line 34ID-E of the Advanced Photon Source (APS) at Argonne National Laboratory. The authors’ previous works [7, 8] only reported measurements along one direction (using a single reflection) for each grain, and thus only the elastic strain/stress along one direction with respect to the sample geometry was reported. In those studies, reflections were measured near (+5° off) the pressing direction, and off the pressing direction (by +23.5°, and −17.5°) for a 1 pass ECAP AA1050 sample. Multiple pass samples (2, 4, and 8 pass) were measured only near the pressing direction (+5°). Theoretically, the ECAP die imposes an approximate +0.88 principal plastic strain for each pass along the +22.5° direction with respect to the pressing direction, −0.88 plastic strain along the −67.5° direction, and about zero plastic strain along the pressing direction [10].
It should be emphasized that since converting strain to stress is a tensor operation, the stress in a given direction cannot be reliably obtained from just the strain in that direction. Thus, although the strains that we reported previously [7, 8] are quantitative with known uncertainties, the corresponding stress values should be considered estimates only. Here, the complete strain tensor is determined, allowing the complete stress tensor to be calculated using the Al single crystal elastic constants.
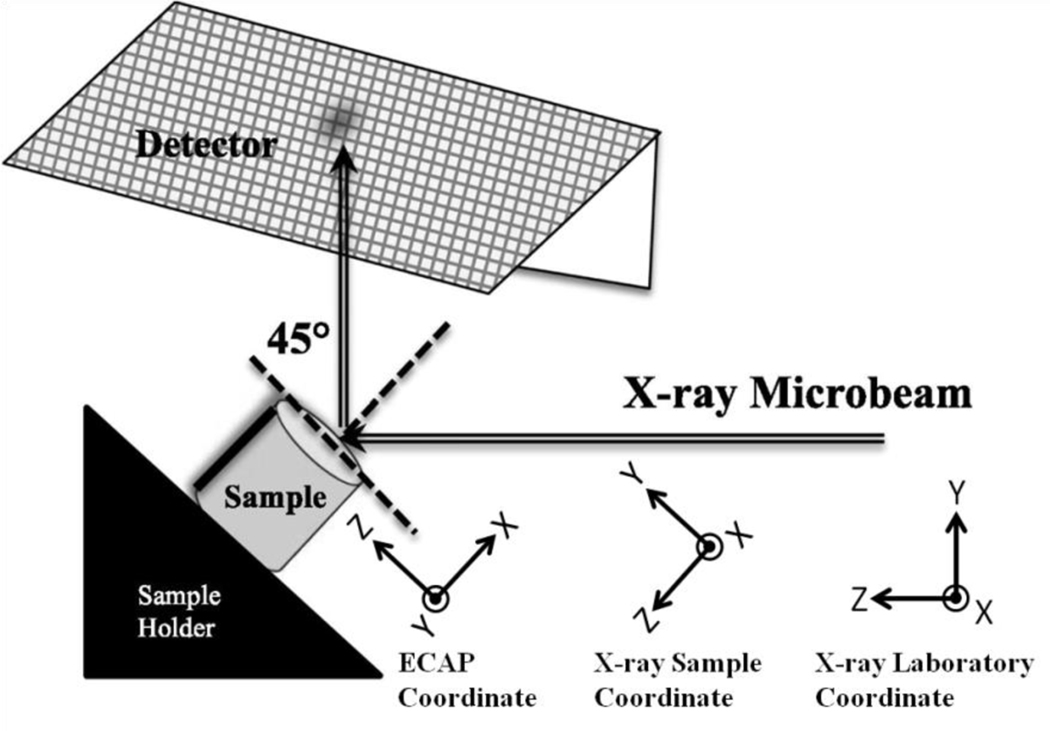
Three linearly independent reflections from each grain were assessed from the same coherently diffracting volume (low dislocation density) within the grain/subgrain. These reflections were used to calculate the full elastic strain and stress tensors, using the measured unstrained lattice constant (which is different than the pure Al lattice parameter) and the Al single crystal elastic constants. The measured elastic strain and stress tensors are then transformed (rotated) into the sample reference frame (Fig.1).
Figure 1.
The X-ray microbeam procedure [7] and the various coordinate systems. The ECAP, X-ray Laboratory, and X-ray Sample coordinate systems are shown in relation to the ECAP sample. The x-direction points out of the page for the X-ray sample and laboratory coordinate systems; the y-direction points out of the page for the ECAP coordinate system. Note that the ECAP coordinate system uses a “left-handed” convention while the X-ray Laboratory and Sample coordinate system use a “right-handed” convention.
Experimental Procedures
The ECAP AA1050 specimens after 1, 2, and 8 passes were identical to those in the Alhajeri et. al. work [6] and previous studies [7, 8]. The samples examined were ECAP AA1050, processed via route BC for multiple passes, with the samples rotated by 90° between each pass [11-13].
Unstrained lattice parameters of AA1050 were measured using the X-ray powder diffraction instrument on the 11-BM beam line at the APS at Argonne National Laboratory. The powder diffraction measurement procedures were identical to those described earlier in [7]. The measured lattice parameter for the as-received (zero ECAP pass) material was 4.05000(10) Å and was used as the unstrained (baseline) lattice parameter a0 for the strain tensor calculations. The unstrained (as-received) sample had no measureable local residual stresses [7, 8].
While simple in theory, full strain tensor measurements are quite complicated in practice and quantitative procedures for measuring them with rigorous uncertainties have only recently become available [14–16]. Measurements for the current study were made with microbeam cross sections of ≈ 0.6 μm × 0.4 μm for the 1 pass sample and ≈ 0.4 μm × 1.4 μm for the 2 pass and 8 pass samples. In contrast to the previous work [7, 8], where only one reflection was measured for each grain, here, three linearly independent reflections were used to obtain three independent lattice spacings and reflection directions associated with each grain/subgrain interior. The full elastic strain and stress tensors from low dislocation volumes within the grain/subgrain of ECAP AA1050 samples were extracted from the data for ECAP AA1050 samples after 1, 2, and 8 passes. Six, eight and seven grain/subgrain interiors were measured for the 1, 2, and 8 pass samples, for a total of 63 reflections.
The geometry (lattice parameters and angles) of the strained unit cell and the crystallographic orientation include 9 unknowns (6 independent components of the elastic strain tensor and 3 components (Euler’s angles) describing the unit cell orientation. By measuring the positions of three independent diffraction spots on the detectors and measuring the corresponding lattice spacings (d-spacings) by performing energy scans, 9 parameters can be extracted, allowing the complete cell geometry and orientation to be determined.
Data collection started by performing a white beam wire scan using the “orange” detector (top). Depth-resolved diffraction patterns were then reconstructed to obtain depth-resolved images. Patterns of diffraction peaks from well-defined diffraction volumes were then indexed. White beam images were then captured using the “purple” and “yellow” detectors (side detectors). By matching the indexed patterns from the orange (top) detector to the purple and yellow (side) detectors, separate diffraction peaks from the same diffraction volume were identified. Three diffraction peaks were chosen based on their intensities and angular separations. Diffraction peaks were chosen from different detectors, when possible, to have the widest angular range between each other, thereby decreasing the uncertainties in the final strain and stress tensors. Diffraction peaks that are high in intensity and well defined in shape result in a more accurate measurement of the lattice spacing (from the energy scans) as well as a more accurate determination of the lattice plane orientation (from the peak centers). Here, the lattice plane orientations represent the plane normal directions of the diffracted peaks. Energy scans were performed on three linearly independent peaks. The lattice spacing, Miller indices of the diffracted peak, and location of the peak centers were determined for each energy scan. These steps were done in a similar fashion to those described by the authors in [16]. Peak locations (on the detectors) were determined both by fitting the peak with a Gaussian surface and calculating the “center-of-mass” of the region surrounding the diffraction peak. A final assessment was made for the values of peak locations by averaging of the results by peak-fitting, calculating the “center of mass”, and by visual inspection [Levine]. For the majority of the cases, peak locations agree well with each other using the two different peak fitting assessments. The variations observed were used as uncertainties in the peak locations. Lattice spacings were determined as described in previous work by Levine et al. [18] Briefly, the X-ray intensity at each pixel is recorded as a function of photon energy during an energy scan. Using these data, a diffraction line profile is constructed for each pixel [17]. The line profiles from all the pixels associated with a given diffraction peak on the detector are then summed to form a composite line profile. The centroid of this line profile in reciprocal space (not to be confused with the diffraction peak center on the detector) is found by fitting the profile using a Gaussian, Lorentzian, or Pseudo-Voigt distribution, as appropriate, depending on the best fit.
Once the energy scans were performed and the diffraction peak data analyzed, the lattice spacings, peak locations, reflection indices and all of the associated uncertainties were used as inputs for a Matlab1 program written to calculate the unit cell parameters and crystallographic orientation. Here, the cubic unit cell lattice spacings a1, b1, c1 and the included angles α1, β1, and γ1 were obtained from the X-ray measurements. The unstrained parameters a0, b0, c0, are simply equal to the ECAP AA1050 unstrained lattice parameter discussed above, and the included angles α0, β0, and γ0 are all 90°. The elastic strain tensor elements were calculated using the strained and unstrained unit cell parameters by the following [18]:
| (1) |
The *signifies that the matrix is symmetric about the diagonal. The full elastic stress tensor was calculated using generalized Hooke’s Law by converting the full strain tensor to Voigt notation (reduced engineering notation) and multiplying it by the appropriate stiffness tensor for Al (Eqn. 2). The elastic constants used in the stiffness matrix [C] were assumed to be C11 = 108.2, C12 = 61.3, and C44 = 28.5 [19]. No uncertainties for these values are available, so the uncertainties in our output values do not include the uncertainties in the elastic constants.
| (2) |
where
The calculated strain and stress tensors describe the full strain/stress state in the coordinate system of the unit cell. However, for the case of ECAP processing, we are interested in examining the full state of stress and strain in the sample coordinate system. First, the rotation matrix used for rotating the strained unit cell into the sample orientation (Fig.1) was determined. This would normally be sufficient to describe the transformation of the stress and strain tensors. However, since the measured strained unit cell basis vectors are no longer orthogonal to each other due to the shear components of the strain tensor, a new orthogonal basis system must be defined for the crystallographic orientation, as described in [16]. Briefly, a new z’ axis is defined as orthogonal to the strained x-y plane, and the new y’ axis is defined as orthogonal to the x-z’ plane. The direction vectors along the x, y’, and z’ axis of the unit cell are calculated. Next, the rotation matrix [R], to rotate between the crystallographic reference frame and the laboratory frame, is calculated. This rotation matrix is then used to transform the strain and stress matrices from the crystallographic orientation into the laboratory orientation (Eqn. 3). The laboratory reference frame is also described by Figure 1.
| (3) |
Note that transformation of the full strain and stress tensors must be done independently. Once the strain and stress tensors are rotated into the lab coordinate system, a second transformation is used to rotate the strain and stress tensors from the lab coordinate system to the sample coordinate system. This is calculated in a similar manner as the first transformation, albeit, with a different rotation matrix, [R1]. The sample was positioned along the X-ray beam with its surface normal oriented +45° from the X-ray direction as described by Figure 1. The rotation matrix to transform the strain and stress tensors from the lab reference frame to the sample reference frame is given by:
| (4) |
The strain and stress tensors in the sample coordinate system are calculated by substituting [R1] in the place of [R] into Eq. 3. Again, the strain and stress tensors are transformed independently (separately) from the lab orientation to the sample orientation following the schematic in Figure 1. Note that the sample coordinate system is defined such that the x-axis is the same direction as the x-axis in the lab coordinate system. The z-axis is along the pressing direction into the sample, and the x-y plane is the sample surface (Figure 1). This is different from the ECAP coordinate system defined by Langdon et al. [20]. We chose to define a new coordinate system due to the left-handed convention used by Langdon et al. [20]. Figure 1 shows the new coordinate system (X-ray Sample Coordinate) following the right-handed convention compared with the coordinate system defined by Langdon (ECAP Coordinate). From this point on, the sample coordinate system and all directions will follow those described by the “X-ray Sample Coordinate” from Figure 1.
The principal strains/stresses and their directions are calculated after the full elastic strain and stress tensors are transformed into the sample coordinate system. This is done by diagonalizing the elastic strain and stress tensors and calculating the eigenvalues and eigenvectors. The eigenvalues are reported as the principal strains/stresses and the associated eigenvectors are the principal strain/stress directions.
Uncertainty Analysis
The uncertainty analysis was performed in an identical way as described by one of the coauthors in [16]. Uncertainties in the final output depend on the uncertainties in the instrument calibration, diffraction peak position on the detector, determination of the center of the line profile (or lattice spacing), the unstrained lattice parameters, and the elastic constants. Instrument calibrations were done as described by [16] to an energy resolution of ΔE/E < 1×10⁻⁴, a root-mean-square angular uncertainty of the peak positions of 0.005° (smaller than the subtended angle between each individual pixel), and the wire angular deviations were less than ≈ 2 mrad [16]. The instrument calibration uncertainties were determined to be small compared to the uncertainties from the deformed ECAP AA1050 diffraction data and were not included in the uncertainty analysis [16].
The uncertainties in the diffraction peak locations (pixel locations on the detectors) and line profile peaks (measured lattice spacings) were propagated through the analysis using a Monte Carlo algorithm to calculate the uncertainties for each of the components of the full elastic strain and stress tensors. For each measured input, an associated uncertainty (in the form of one standard deviation) was determined. An input array of 10,000 numbers was then generated. The input array has a Gaussian distribution with a center at the exact input, and a standard deviation determined by the uncertainty. This is equivalent to generating 10,000 variants for each set of diffraction measurements. The full elastic strain and stress tensors are then calculated 10,000 times, using the different variants of the measured inputs. Thus, there are 10,000 full elastic strain and stress tensor outputs for each measured set of inputs. Each component of the output elastic strain and stress tensors is analyzed and its standard deviation is calculated. This is then reported as the uncertainty in the output value.
Results and Discussion
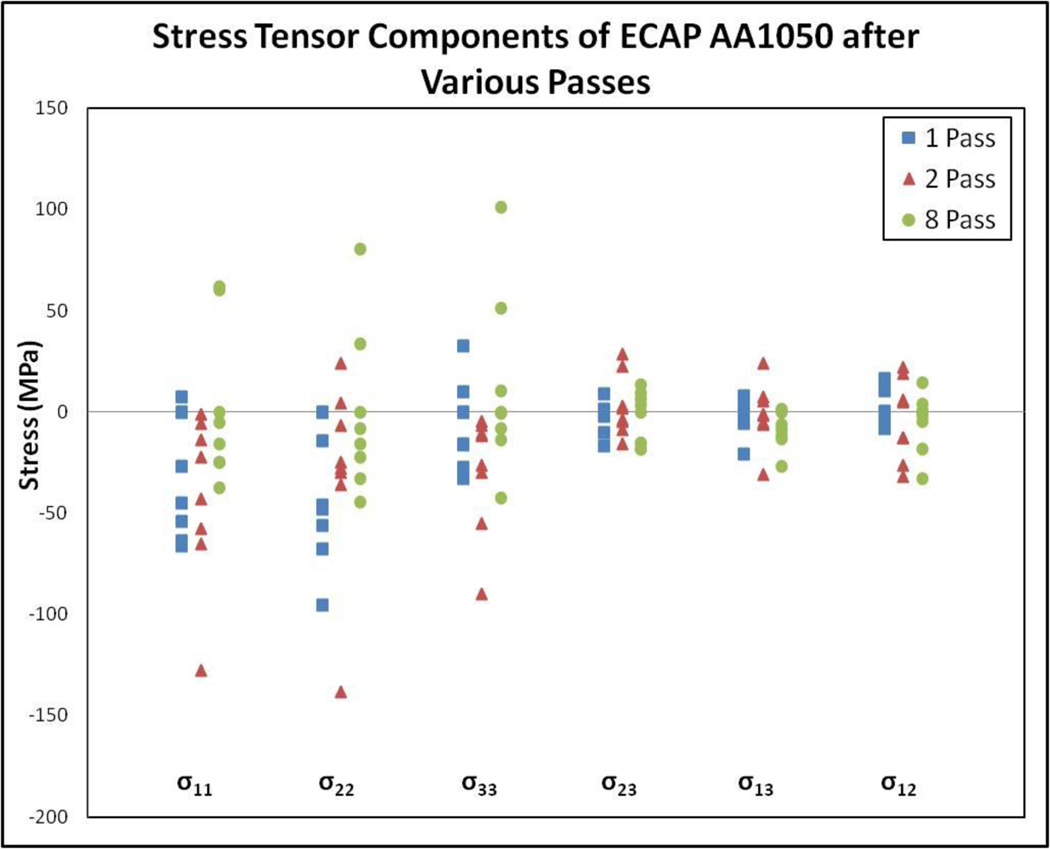
The long range internal stress tensor components of all measured low dislocation density regions within the grain/subgrain interiors (in the sample reference frame) from the 1, 2, and 8 pass samples are plotted in Figure 2. Powder diffraction results from earlier works [7, 8] indicated that the ECAP AA1050 specimens (for 1, 2, and 8 pass samples) have no detectable residual stress and all stresses that are present are long range internal stresses (LRIS). The 11 (x) and 22 (y) directions define the plane normal to the pressing axis (z, 33 direction).
Figure 2.
Long range internal stress tensor components in the sample coordinate system for ECAP AA1050 after various passes. The σ33 component is along the ECAP axis.
The 1 pass sample exhibits mostly negative LRISs in the 11 (x) and 22 (y) directions, and on average, zero stress along the pressing direction. The 2 pass sample exhibits mostly negative stresses along all x, y, and z directions with the exception of two positive values along the y direction. Normal stress components for the 8 pass sample are slightly negative along the x direction, while roughly zero along the y and z directions. The stresses in the 8 pass sample are more isotropic than those in the 1 pass and 2 pass samples. Since the geometry of the grains/subgrains for the 1 pass and 2 pass samples are not fully isotropic (significant grain elongation and not fully homogenous), and evolve to a more isotropic geometry with repeated ECAP passes with rotation (route BC), the state of stress for the 8 pass sample is consistent with what we would expect for the homogenized microstructures.
Three principal long range internal stresses are calculated for each grain/subgrain interior. Table 1 lists the long range internal stresses along the principal stress directions of ECAP AA1050 after 1 pass for 6 grain/subgrain interiors. The LRISs are listed as principal stresses (σ1, σ2, and σ3) in order of value from largest to smallest. LRISs are also listed as fractions of the flow stress (σa = 148 MPa for the 1 pass sample [21])
Table 1.
Long range internal stresses of ECAP AA1050 after 1 Pass for 6 low dislocation density volumes within the grains/subgrains along the principal stress directions. “G” refers to different grain interiors. (σa = 148 MPa for 1 pass sample [21])
| ECAP AA1050 1 Pass | ||||||
|---|---|---|---|---|---|---|
| Principal Stresses | G1 | G2 | G3 | G4 | G5 | G6 |
| σ1 (MPa) | 50±14 | 12±15 | −25±13 | −16±15 | −16±12 | −21±17 |
| σ2 (MPa) | −4±14 | −45±19 | −64±20 | −40±18 | −42±18 | −38±15 |
| σ3 (MPa) | −20±18 | −48±20 | −98±22 | −72±18 | −73±17 | −70±22 |
| σ1/σa | 0.34±0.10 | 0.08±0.10 | −0.17±0.09 | −0.11±0.10 | −0.11±0.08 | −0.14±0.11 |
| σ2/σa | −0.03±0.10 | −0.31±0.13 | −0.43±0.13 | −0.27±0.12 | −0.29±0.12 | −0.25±0.10 |
| σ3/σa | −0.14±0.12 | −0.33±0.13 | −0.66±0.15 | −0.48±0.12 | −0.49±0.11 | −0.47±0.15 |
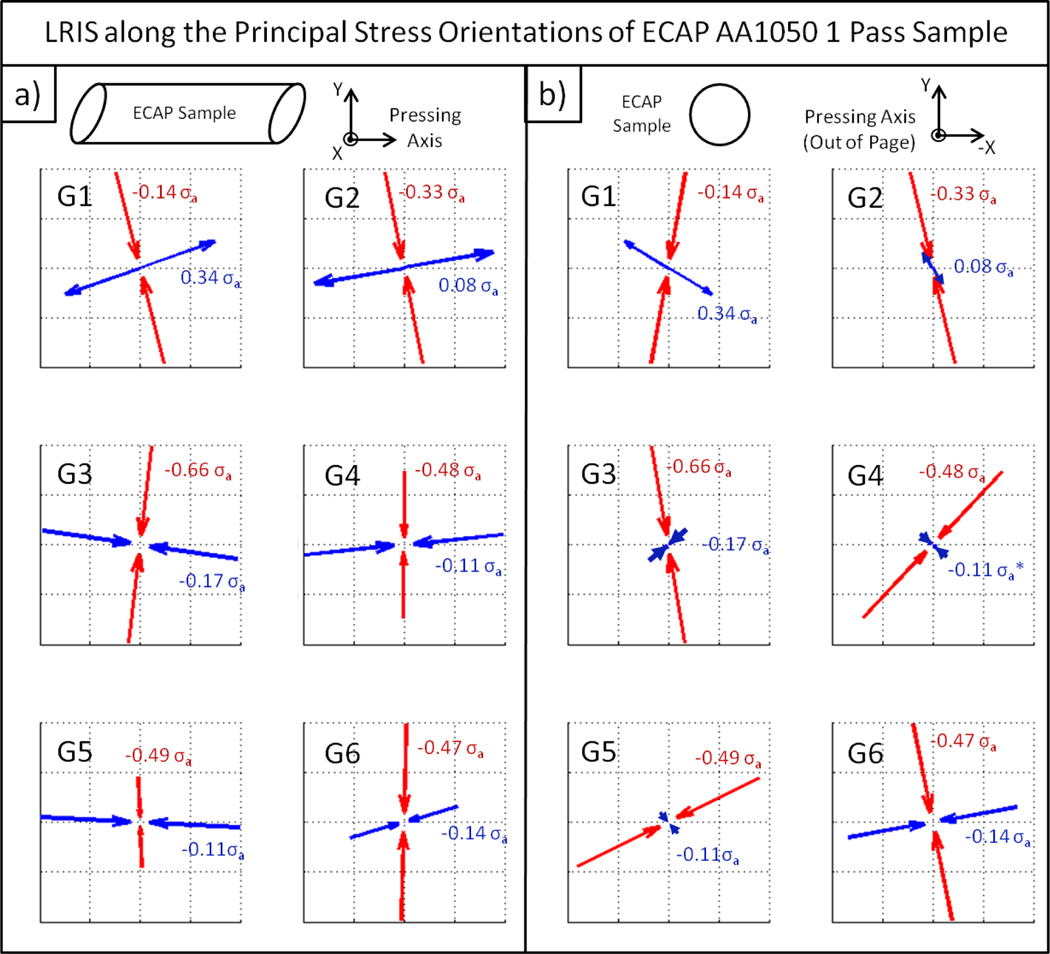
Figure 3 shows the orientations of the LRISs listed in Table 1. Figure 3 illustrates the orientations along two different points of view: a) with the ECAP plane parallel to the page and the pressing direction pointing toward the right, and b) with the pressing direction pointing out of the page. The arrows have lengths of 1 (normalized) and describe the principal stress orientations (axes). For each grain/subgrain interior, the blue arrows describe the orientations of the σ1-LRISs, and the red arrows illustrate the orientations of the σ3-LRISs. The directions of the arrows describe whether the LRIS is compressive (pointing toward each other), or tensile (pointing away from each other). The LRISs are listed in corresponding colors as fractions of the flow stress (σa = 148 MPa for the 1 pass sample [21]) next to the corresponding arrows. Values in Figure 3 are identical to values listed as “σ1” (for blue values), and “σ3” (for red values) in Table 1.
Figure 3.
LRIS within the 6 grain/subgrain interiors along the principal stress orientations of ECAP AA1050 after 1 pass. The arrows describe the axes of the principal stresses (σ1(max) and σ3 (min)). The blue arrows illustrate the orientations of the σ1-LRIS (maximum principal stress), and the red arrows illustrate the orientations of the σ3-LRIS (minimum principal stress). a) shows the side view, with the ECAP plane parallel to the page and pressing direction pointing toward the right. b) shows the cross sectional view, with the pressing axis pointing out of the page. The coordinate system is consistent with that of the “Sample X-ray Coordinate” system described earlier in Figure 1.
On average, the σ1-LRIS (maximum principal stress) orientations (blue arrows) for the 1 pass sample align well with the pressing axis, and the σ3-LRIS (minimum principal stress) orientations (red arrows) align roughly with the vertical axis (y-axis). The average of the σ1-LRIS (maximum principal stress) values for the 6 grain/subgrain interiors is −3 MPa ± 6 MPa (−0.02 σa ± 0.04 σa) or practically zero. The average of the σ3-LRIS (minimum principal stress) values between 6 grain/subgrain interiors is −63 MPa ± 8 MPa (−0.43 σa ± 0.05 σa). The average maximum (in magnitude) LRIS within the 1 pass sample is then roughly −0.43 σa ± 0.05 σa, which signifies a compressive stress, and points roughly along the vertical axis (y-axis).
In theory, the ECAP process imposes a compressive plastic strain along the vertical direction (y-axis). With a simple 2-component composite model [9], we would expect to observe a tensile LRIS within the grain/subgrain interiors along this direction. However, values of the LRIS near the vertical direction (y-axis) are the maximum (in magnitude) LRISs and are all compressive. This suggests that the simple 2-component composite model may not apply to the complex strain path and/or the microstructure of deformed ECAP AA1050. This will be discussed in detail later.
Tables 2 and 3 list the long range internal stresses along the principal stress directions of ECAP AA1050 after 2 and 8 passes, respectively. Again, three principal stresses (LRIS) are calculated from each grain/subgrain interior.
Table 2.
Long range internal stresses of ECAP AA1050 after 2 passes for 8 low dislocation density volumes within the grains/subgrains along the principal stress directions. “G” refers to different grain interiors. (σa = 150 MPa for the 2 pass sample [21])
| ECAP AA1050 2 Pass | ||||||||
|---|---|---|---|---|---|---|---|---|
| Principal Stresses | G1 | G2 | G3 | G4 | G5 | G6 | G7 | G8 |
| σ1 (MPa) (max) | 19 ± 21 | 18 ± 23 | −5 ± 18 | 35 ± 18 | −9 ± 18 | 8 ± 19 | −18 ± 17 | −88 ± 15 |
| σ2 (MPa) | −20 ± 20 | −14 ± 19 | −7 ± 16 | −30 ± 15 | −38 ± 17 | 1 ± 17 | −28 ± 13 | −110 ± 19 |
| σ3 (MPa) (min) | −54 ± 19 | −49 ± 19 | −24 ± 18 | −100 ± 18 | −73 ± 17 | −11 ± 17 | −52 ± 15 | −160 ± 22 |
| σ1/σa | 0.12 ± 0.14 | 0.12 ± 0.15 | −0.03 ± 0.12 | 0.23 ± 0.12 | −0.06 ± 0.12 | 0.05 ± 0.13 | −0.12 ± 0.11 | −0.59 ± 0.10 |
| σ2/σa | −0.13 ± 0.13 | −0.09 ± 0.12 | −0.05 ± 0.11 | −0.20 ± 0.10 | −0.25 ± 0.12 | 0.01 ± 0.11 | −0.18 ± 0.09 | −0.72 ± 0.13 |
| σ3/σa | −0.36 ± 0.13 | −0.33 ± 0.13 | −0.16 ± 0.12 | −0.68 ± 0.12 | −0.49 ± 0.11 | −0.07 ± 0.12 | −0.35 ± 0.10 | −1.07 ± 0.15 |
Table 3.
Long range internal stresses of ECAP AA1050 after 8 passes for 7 low dislocation density volumes within the grains/subgrains along the principal stress directions. “G” refers to different grain interiors. (σa = 200 MPa for the 8 pass sample [21])
| ECAP AA1050 8 Pass | |||||||
|---|---|---|---|---|---|---|---|
| Principal Stresses | G1 | G2 | G3 | G4 | G5 | G6 | G7 |
| σ1 (MPa) (max) | −25 ± 14 | −11 ± 15 | 23 ± 17 | 4 ± 12 | 68 ± 19 | 130 ± 22 | 0 ± 17 |
| σ2 (MPa) | −44 ± 15 | −17 ± 17 | 1 ± 21 | −16 ± 16 | 56 ± 19 | 79 ± 15 | −10 ± 20 |
| σ3 (MPa) (min) | −56 ± 18 | −27 ± 18 | −27 ± 16 | −28 ± 17 | 22 ± 18 | 32 ± 16 | −56 ± 23 |
| σ1/σa | −0.12 ± 0.07 | −0.06 ± 0.08 | 0.12 ± 0.09 | 0.02 ± 0.06 | 0.34 ± 0.10 | 0.65 ± 0.11 | 0.00 ± 0.09 |
| σ2/σa | −0.22 ± 0.08 | −0.09 ± 0.09 | 0.00 ± 0.10 | −0.08 ± 0.08 | 0.28 ± 0.10 | 0.39 ± 0.08 | −0.05 ± 0.10 |
| σ3/σa | −0.28 ± 0.09 | −0.14 ± 0.09 | −0.14 ± 0.08 | −0.14 ± 0.09 | 0.11 ± 0.09 | 0.16 ± 0.08 | −0.28 ± 0.11 |
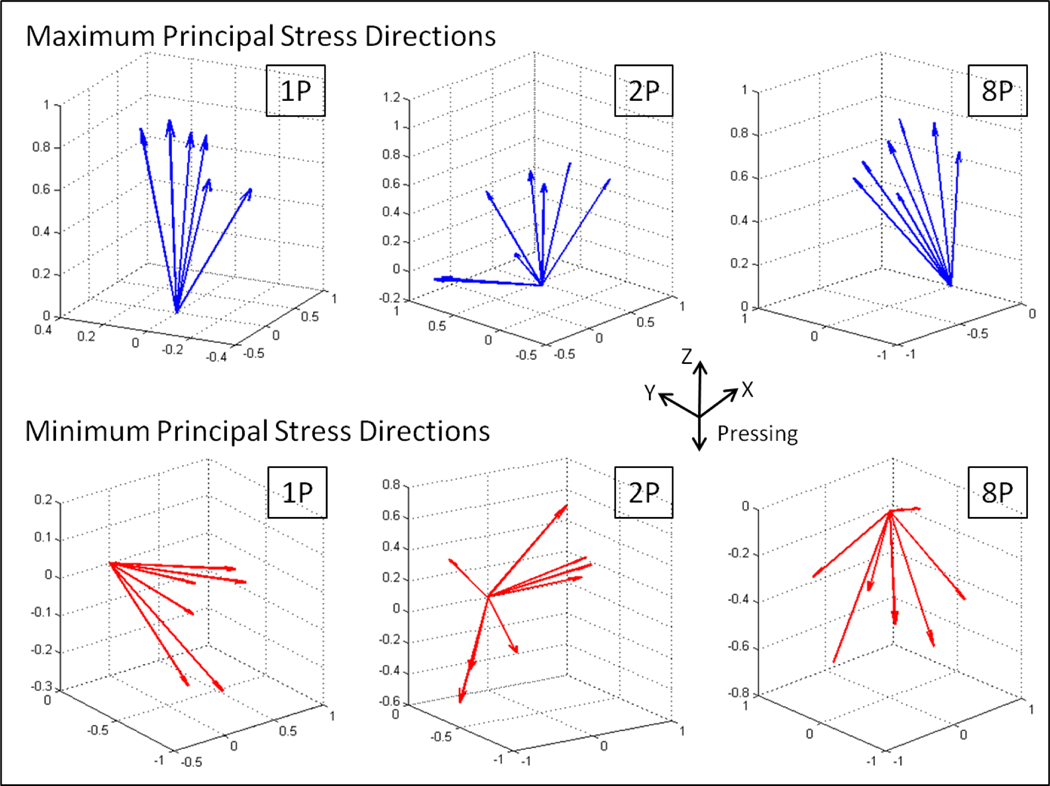
Figure 4. shows the orientations of the σ1-LRISs (maximum principal stresses) and σ3-LRISs (minimum principal stresses) for all the measured low dislocation density regions within the grain/subgrain interiors for 1, 2, and 8 pass samples. Each blue arrow represents the direction of the σ1-LRIS and each red arrow represents the direction of σ3-LRIS for each examined low dislocation density region within the grain/subgrain interiors.
Figure 4.
Maximum (σ1-LRIS) and minimum (σ3-LRIS) principal stress directions of grain/subgrain interiors of ECAP AA1050 after various passes. The coordinate system is identical to that of the “Sample X-ray Coordinate” system described earlier in Figure 1.
The σ1-LRIS and σ3-LRIS directions for the 1 pass sample are the most directional (grouped together) compared to the 2 and 8 pass samples. Again, for the 1 pass sample, the σ1-LRISs directions are roughly along the z-axis, or the pressing direction, with little out of ECAP-plane variations (ECAP-plane is described by the y-z plane). It is observed that the σ1-LRISs directions for the 2 pass and 8 pass samples have much larger variations, as well as off-axis components (x-axis), compared with the 1 pass sample. This might be expected due to the 90° sample rotation between each route-BC ECAP pass. While it is not shown here, the principal elastic strain directions for all samples are similar to the principal LRIS directions in Figure 4. Observations regarding the directionality of the principal LRIS directions apply to the directionality of the elastic principal strain directions.
The average of the σ1-LRIS (maximum principal stress) values for the 2 pass sample between 8 grain/subgrain interiors is −5 MPa ± 6 MPa (−0.03 σa ± 0.04 σa, σa = 150 MPa for the 2 pass sample [21]). The average of the σ3-LRIS (minimum principal stress) values is −65 MPa ± 6 MPa (−0.44 σa ± 0.04 σa). The average maximum (in magnitude) LRIS within the 2 pass sample is then roughly −0.44 σa ±0.04 σa, which signifies a compressive stress. Since the orientation of the σ3-LRIS (minimum principal stress) is largely random for the 2 pass sample (Figure 4), this implies that the direction of the maximum (in magnitude) LRIS varies significantly from grain to grain for the 2 pass sample.
The average of the σ1-LRIS (maximum principal stress) values for the 8 pass sample from 7 grain/subgrain interiors is 27 MPa ± 6 MPa (0.14 σa ± 0.03 σa, σa = 200 MPa for the 8 pass sample [21]). The average of the σ3-LRIS (minimum principal stresses) values is −20 MPa ± 7 MPa (−0.10 σa ± 0.03 σa). The average maximum (in magnitude) LRIS within the 8 pass sample is then roughly 0.14 σa ± 0.03 σa, which signifies a tensile stress, and is somewhat close to the pressing axis for the 8 pass sample. This average maximum stress is also much smaller than those found in the 1 pass (−0.43 σa ± 0.05 σa) and 2 pass (−0.44 σa ± 0.04 σa) samples.
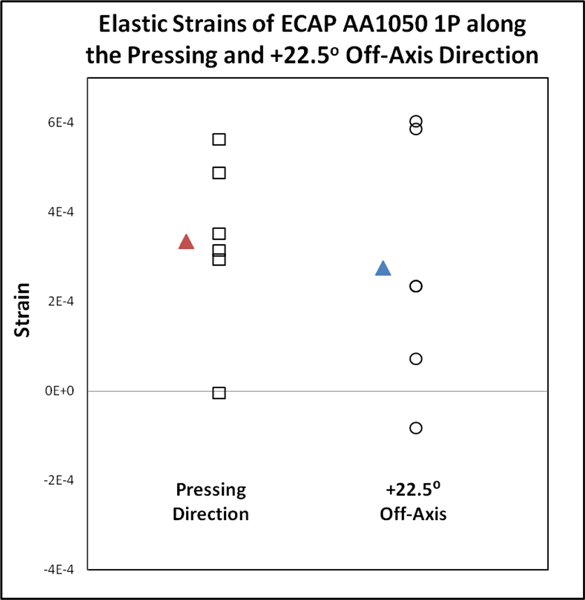
Figure 5. shows the long range internal elastic strains along the pressing direction and along the +22.5° off-axis direction for the 1 pass sample. As mentioned previously, the theoretical maximum (tensile) plastic strain direction (+0.88) is +22.5° off axis for the ideal case (e.g. no friction), with zero plastic strain along the pressing direction [10]. We therefore might expect a large difference between the measured elastic strains between these two directions. However, only a small decrease (a strain of ≈ 6 × 10⁻⁵) is observed from the average elastic strain along the pressing direction to the average elastic strain along the +22.5° off-axis direction. This decrease in strain was very similar to that observed in a previous work [7], where a decrease of 8 × 10⁻⁵ was reported from the near-pressing direction (+4.9°) to the +27.5° direction.
Figure 5.
Elastic strains along the pressing and +22.5° off axis directions of ECAP AA1050 sample after 1 pass. Average values are plotted as solid triangles to the left of the elastic strain values.
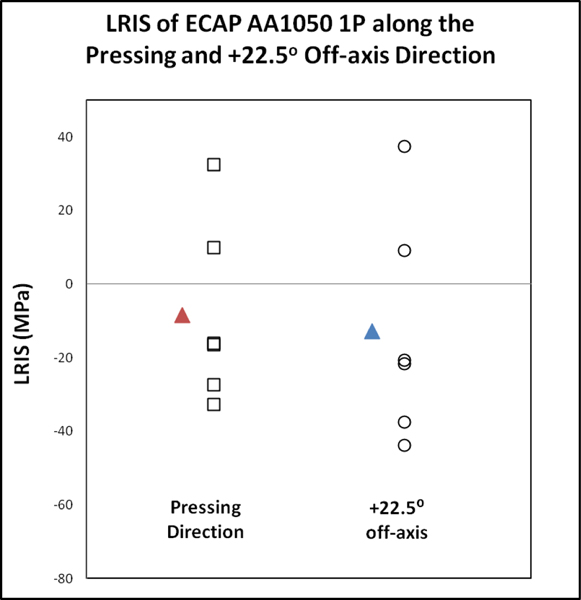
Figure 6. shows the long range internal stresses along the pressing and +22.5° off-axis directions of ECAP AA1050 after 1 pass. The average LRIS is −8.4 MPa, or −0.06 σa, along the pressing direction, and −12.8 MPa, or −0.09 σa, along the +22.5° off-axis direction. In contrast to the small positive average elastic strains, the average LRISs are slightly negative and close to zero. Since the uncertainties for the stresses are approximately ±17 MPa, these small stresses are effectively indistinguishable from zero stress. The LRISs along these directions are comparable to the LRIS reported in the previous work [7], where the LRISs were calculated to be ≈ −13.6 MPa and −19 MPa along the +4.9° off-axis and +27.3° off-axis, respectively. It is noted that the LRIS values reported in [7] were derived by simply multiplying the strain along the particular direction by the Young’s modulus of Al, and thus are not strictly comparable to the more rigorous LRIS values reported in this work.
Figure 6.
Long range internal stresses along the pressing and +22.5° off-axis directions of ECAP AA1050 sample after 1 pass. Average values are plotted as solid triangles to the left of the elastic strain values.
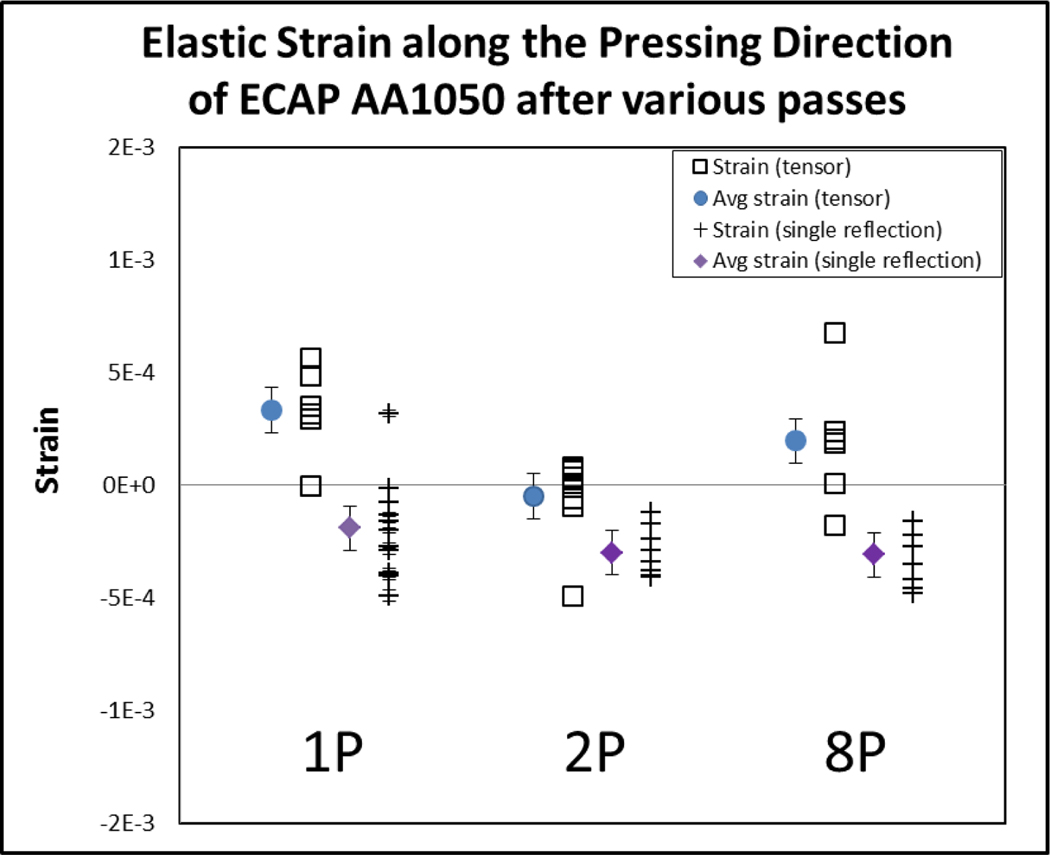
Figure 7 shows the elastic strain of grain/subgrain interiors along the pressing direction from the 1, 2, and 8 pass samples for both the present work (calculated using tensor analysis) and previous work (calculated using a single reflection). The average values are plotted to the left of the strain values as solid dots for the tensor calculated values and as solid diamonds for the single reflection calculated values. The average elastic strains along the pressing direction are 3.3 × 10⁻⁴, −4.8 × 10⁻⁵, and 1.97 × 10⁻⁴, for the 1, 2, and 8 pass samples respectively for the tensor calculated values. For comparison, the previously reported [8] elastic strains measured along the near pressing direction (+4.9° off-axis) are also plotted in Fig 7. For these, the average strains are −1.9 × 10⁻⁴, −3.0 × 10⁻⁴, and −3.1 × 10⁻⁴ for all 1, 2, and 8 pass samples, respectively. Typical uncertainties resulting from a combination of statistical and calibration uncertainties for the measured elastic strain values are approximately 1× 10⁻⁴ and are plotted as error bars for the average elastic strain values.
Figure 7.
Elastic strain along the pressing direction for ECAP AA1050 grain/subgrain interiors calculated by tensor analysis and single reflection measurements after 1, 2, and 8 passes. Average elastic strains are plotted to the left of the strain values as solid dots for the tensor calculated values and solid diamonds for the single reflection values from previous works [8].
Although the measured distributions of elastic strains from both studies overlap, the uncertainties for the mean values do not. This signifies a real (though small) shift between mean elastic strain values measured in the present work and those from previous work [8]. The shift is almost certainly due to small residual stresses that were averaged over by the large-volume powder diffraction measurement used to determine the appropriate lattice constant. We note that averaging the elastic strains from both studies further reduces the already small average strains in the pressing direction to approximately zero, consistent with the zero plastic strain along this direction.
As described above, low dislocation regions within the 1 pass sample exhibit large compressive stresses in the vertical (y-axis) direction, even though the ECAP process imposes large compressive plastic strains in the same direction. This behavior is directly contrary to the sign reversal predicted by the simple 2-component composite model [9]. The sign reversal between imposed plastic strain and the unloaded stresses in low dislocation density regions has been directly confirmed by synchrotron X-ray microdiffraction studies of uniaxially deformed single crystal Cu [17, 22]. In light of these previous successes, the apparent failure of the composite model for ECAP is surprising. We see two feasible explanations. First, the original descriptions of the composite model consider only proportional loading under both uniaxial deformation and large-cycle fatigue. Here, the strain path is markedly non-proportional and the underlying dislocation structure evolution must reflect this different path. Put another way, plastic strain is not a state variable, so different strain paths to the same final plastic strain state can produce markedly different dislocation configurations and stress states. Another feasible explanation for the failure of the 2-component composite model is that the assumption of a 2-component system may not apply to the microstructure of deformed ECAP AA1050. That is, in addition to the high and low dislocation density regions within the grains and subgrains, the relatively sharp (nm scale), high angle boundaries may serve as an additional component that cannot be neglected. The stress balance in ECAP AA1050 may need to be described using a 3-component stress balance, such that the stresses in the low dislocation density regions within grain/subgrain interiors must be balanced by the stresses in both the high dislocation density regions within the grain/subgrain interiors and the grain/subgrain boundaries.
It is worthwhile to discuss the adequacy of the LRIS measured near the grain/subgrain boundaries by Alhajeri et. al.[6] using CBED which we utilized for a 3-component stress balance analysis in our previous work [7]. Measurements made by [6] gave a maximum principal LRIS of 0.75 σa near the grain/subgrain boundaries. However, the orientation of the 2D strain tensor measured in [6] was not specified. The full LRIS tensor measured in the present work shows the importance of orientation since the LRISs vary drastically in magnitude and sign along different orientations. This suggests that the values measured by CBED [6] may be inadequate and assessments of LRIS are best accomplished with the analysis of the full elastic strain tensor.
Conclusions
Elastic long-range internal strain and stress tensors have been assessed for submicrometer-size volumes within the low dislocation density regions within the grain/subgrain interiors of ECAP AA1050. This is the first time that full tensors have been measured from submicrometer sample volumes within plastically-deformed metal samples. While other ECAP studies have shown microstructure homogenization [11, 12, 23], the measurements reported here are the first confirmation that the local LRIS stresses and strains also become increasingly isotropic after a large number of ECAP passes with sample rotation using route Bc. Furthermore, the directions of the principal LRISs (σ1 and σ3-LRISs) show that elastic strains and LRISs in grain/subgrain interiors are most aligned for the 1 pass sample, and are relatively random for the 2 and 8 pass samples.
For the 1 pass sample, the largest compressive stresses are aligned approximately along the vertical (y axis) direction and the largest tensile (or least compressive) stresses are aligned approximately along the pressing (z axis) direction. Interestingly, these directions correspond to high symmetry orientations for the sample/die geometry and not to the directions of maximum and minimum plastic strain.
Measured maximum LRISs are present in ECAP AA1050 samples at a level of about 0.44 of the applied stress for 1 and 2 pass samples and about 0.14 of the applied stress for 8 pass samples. These stresses are substantially larger than those found using similar methods in deformed Cu single crystals (0.1 the applied stress) [17].
The LRIS values obtained using the tensor assessment method differ slightly from those found in a previous study using single reflection measurements [8]. These stress differences are larger than the measurement uncertainties and are attributed to small residual stresses in the specimen over length scales larger than the grain size and smaller than the macroscopic volumes used to measure the unstrained lattice parameter.
Finally, the predictions of the two-component composite model [9] for uniaxial deformation are inconsistent with the measured stresses. Two feasible explanations for this failure are 1) that the plastic strain path is markedly non-proportional and 2) that the stress balance for ECAP Al may need to be calculated using a three-component model.
Acknowledgements
Research at the University of Southern California was supported the National Science Foundation through DMR-1401194, the XOR/UNI facilities on 11-BM and 34ID at the APS are supported by the DOE Office of Science under Contract No. DE-AC02-06CH11357, and research at the University of Southampton was supported by the European Research Council under ERC Grant Agreement No. 267464-SPDMETALS.
Footnotes
Certain commercial equipment, instruments, software, or materials are identified in this paper to foster understanding. Such identification does not imply recommr1endation or endorsement by the National Institute of Standards and Technology, nor does it imply that the materials or equipment identified are necessarily the best available for the purpose.
References
- [1].Iwahashi Y, Furukawa M, Horita Z, Nemoto M, Langdon T, Metallurgical and Materials Transactions A, 29 (1998) 2245–2252. [Google Scholar]
- [2].Raab GJ, Valiev RZ, Lowe TC, Zhu YT, Materials Science and Engineering: A, 382 (2004) 30–34. [Google Scholar]
- [3].Valiev RZ, Langdon TG, Progress in Materials Science, 51 (2006) 881–981. [Google Scholar]
- [4].Cabibbo M, Blum W, Evangelista E, Kassner ME, Meyers MA, Metallurgical and Materials Transactions A, 39 (2007) 181–189. [Google Scholar]
- [5].Oh-ishi K, Horita Z, Smith DJ, Langdon TG, Journal of Materials Research, 16 (2001) 583–589. [Google Scholar]
- [6].Alhajeri SN, Fox AG, Langdon TG, Acta Materialia, 59 (2011) 7388–7395. [Google Scholar]
- [7].Lee IF, Phan TQ, Levine LE, Tischler JZ, Geantil PT, Huang Y, Langdon TG, Kassner ME, Acta Materialia, 61 (2013) 7741–7748. [DOI] [PMC free article] [PubMed] [Google Scholar]
- [8].Phan TQ, Lee IF, Levine LE, Tischler JZ, Huang Y, Fox AG, Langdon TG, Kassner ME, Scripta Materialia, 93 (2014) 48–51. [Google Scholar]
- [9].Mughrabi H, Acta Metallurgica, 31 (1983) 1367–1379. [Google Scholar]
- [10].Xia K, Wang J, Metallurgical and Materials Transactions, 32A (2001) 2639. [Google Scholar]
- [11].Alhajeri SN, Gao N, Langdon TG, Materials Science and Engineering: A, 528 (2011) 3833–3840. [Google Scholar]
- [12].Kawasaki M, Horita Z, Langdon TG, Materials Science and Engineering: A, 524 (2009) 143–150. [Google Scholar]
- [13].Furukawa M, Iwahashi Y, Horita Z, Nemoto M, Langdon TG, Materials Science and Engineering: A, 257 (1998) 328–332. [Google Scholar]
- [14].Okoro C, Levine LE, Xu R, Tischler JZ, Liu W, Kirillov O, Hummler K, Obeng YS, in IEEE, pp. 648–652. [Google Scholar]
- [15].Okoro C, Levine LE, Xu R, Obeng Y, J Mater Sci, 50 (2015) 6236–6244. [Google Scholar]
- [16].Levine LE, Okoro C, Xu R, IUCrJ, 2 (2015) 635–642. [DOI] [PMC free article] [PubMed] [Google Scholar]
- [17].Levine LE, Geantil P, Larson BC, Tischler JZ, Kassner ME, Liu W, Stoudt MR, Tavazza F, Acta Materialia, 59 (2011) 5803–5811. [Google Scholar]
- [18].Schlenker JL, Gibbs GV, Boisen MB, Acta Crystallographica Section A, 34 (1978) 52–54. [Google Scholar]
- [19].Dieter GE, Mechanical metallurgy, McGraw-Hill, New York, 1976. [Google Scholar]
- [20].Langdon TG, Acta Materialia, 61 (2013) 7035–7059. [Google Scholar]
- [21].Yu CY, Sun PL, Kao PW, Chang CP, Scripta Materialia, 52 (2005) 359–363. [Google Scholar]
- [22].Levine LE, Larson BC, Yang W, Kassner ME, Tischler JZ, Delos-Reyes MA, Fields RJ, Liu W, Nature Materials, 5 (2006) 619–622. [DOI] [PubMed] [Google Scholar]
- [23].Xu C, Horita Z, Langdon TG, Materials Science and Engineering: A, 528 (2011) 6059–6065. [Google Scholar]


