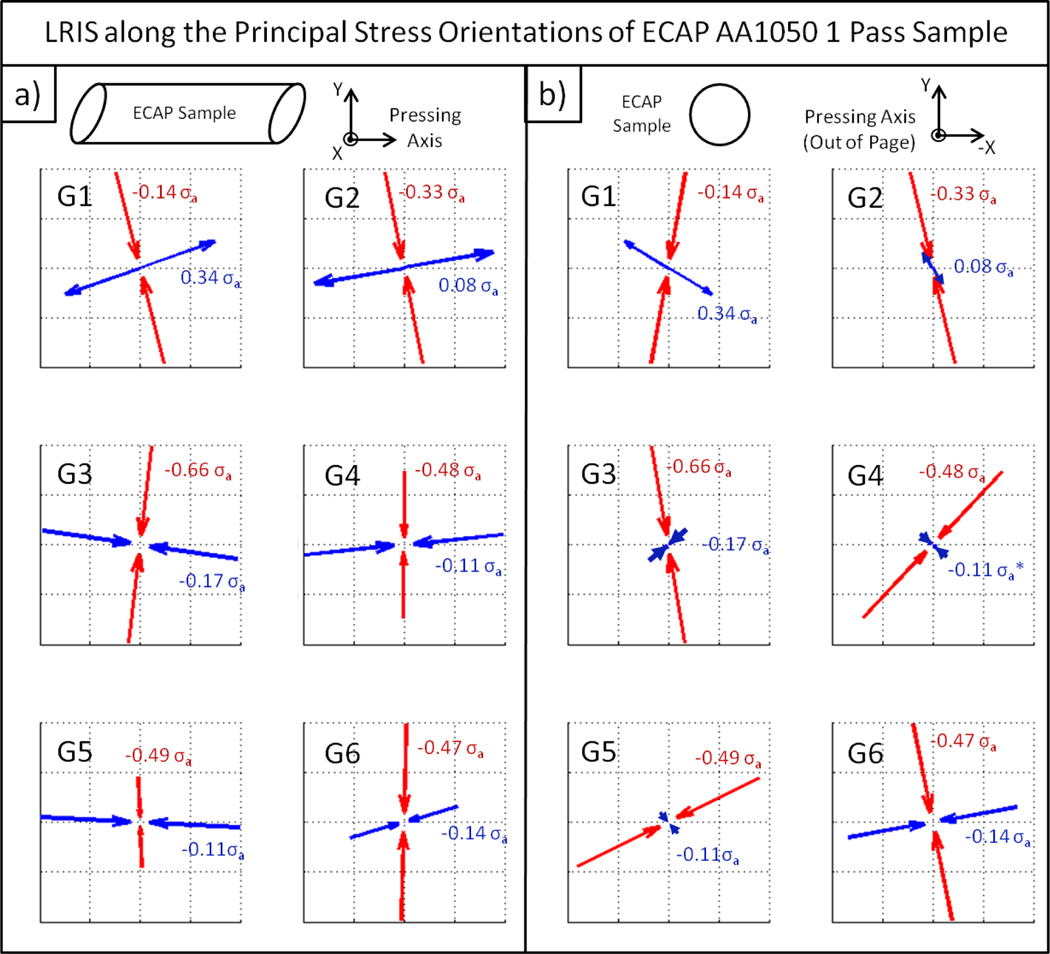
Figure 3.
LRIS within the 6 grain/subgrain interiors along the principal stress orientations of ECAP AA1050 after 1 pass. The arrows describe the axes of the principal stresses (σ1(max) and σ3 (min)). The blue arrows illustrate the orientations of the σ1-LRIS (maximum principal stress), and the red arrows illustrate the orientations of the σ3-LRIS (minimum principal stress). a) shows the side view, with the ECAP plane parallel to the page and pressing direction pointing toward the right. b) shows the cross sectional view, with the pressing axis pointing out of the page. The coordinate system is consistent with that of the “Sample X-ray Coordinate” system described earlier in Figure 1.

