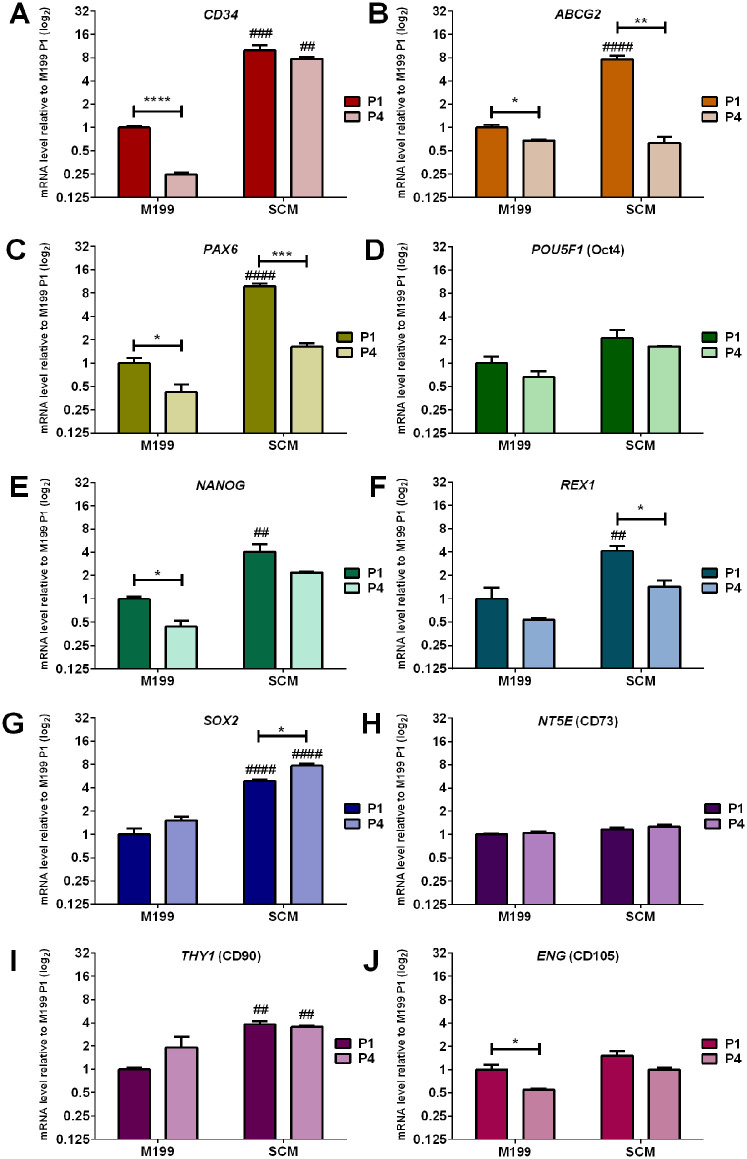
Figure 2.
Comparative effect of culture medium on mRNA expression of C-MSC. Cells were continually cultured in either M199 or SCM. Relative levels of mRNA were determined by RT-qPCR for the following genes (A) CD34 (B) ABCG2, (C) PAX6, (D) POU5F1, (E) NANOG, (F) REX1, (G) SOX2, (H) NT5E, (I) THY1, (J) ENG. C-MSC were analyzed at the end of passage 1 (P1) and passage 4 (P4). Expression of each target gene was normalized to GAPDH and represented relative to mRNA expression of M199 at P1. Data shown as mean ± SEM of three independent experiments with different C-MSC donors (n = 3), each with three replicates. Statistical significance of P1 vs. P4 of same medium: *P ≤ 0.05, **P ≤ 0.01, ***P ≤ 0.001. Statistical significance SCM vs. M199 P1: ##P ≤ 0.01, ###P ≤ 0.001, ####P ≤ 0.0001.

