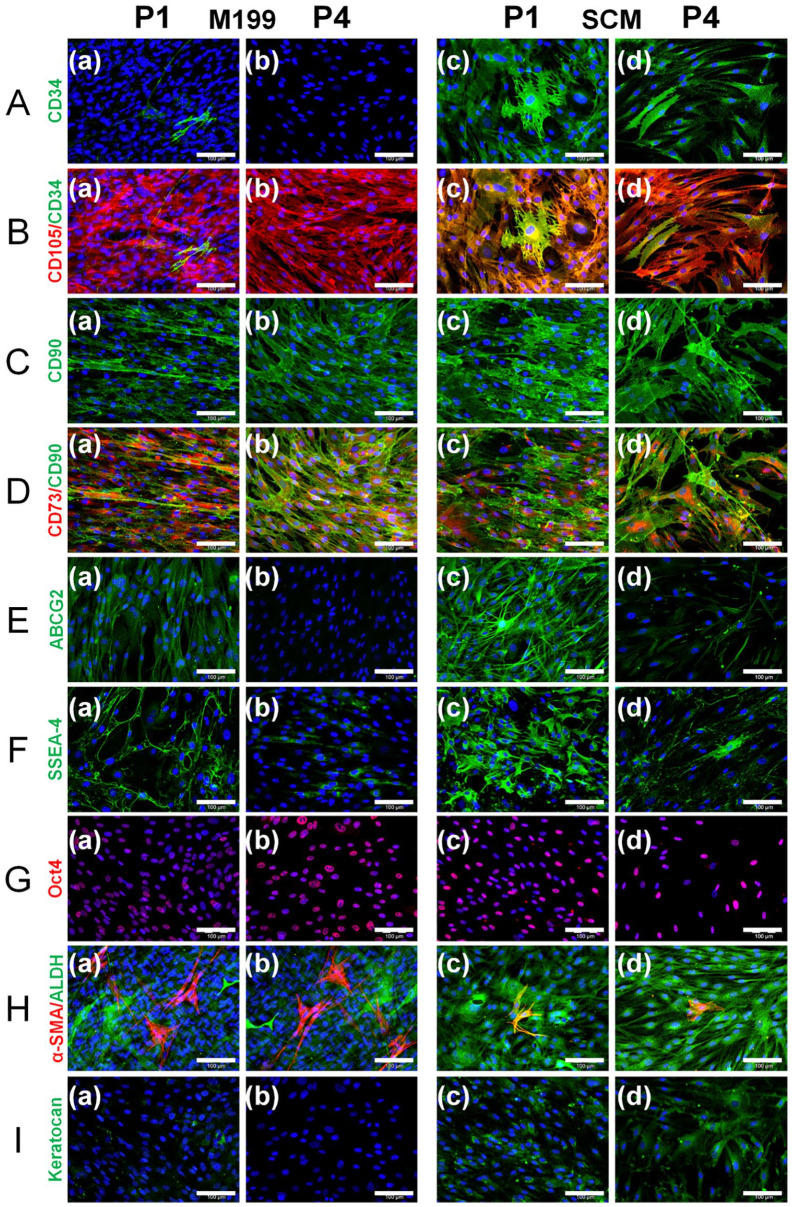
Figure 3.
Comparative effect of culture medium on protein expression of C-MSC at P1 and P4. C-MSC were continually cultured in (a, b) M199 or (c, d) SCM and immunocytochemistry was performed at passage 1 (P1; a, c) and passage 4 (P4; b, d) for (A) CD34 (green), (B) CD105 (red) shown merged with CD34 (green), (C) CD90 (green), (D) CD73 (red) shown merged with CD90 (green), I ABCG2 (green), (F) SSEA-4 (green), (G) Oct4A (red), (H) α-SMA (red) shown merged with ALDH3A1 (green), and (I) keratocan (green). Representative images shown of three independent experiments with three different C-MSC donors (n = 3) with DAPI counterstain (blue), scale bar=100 μm.

