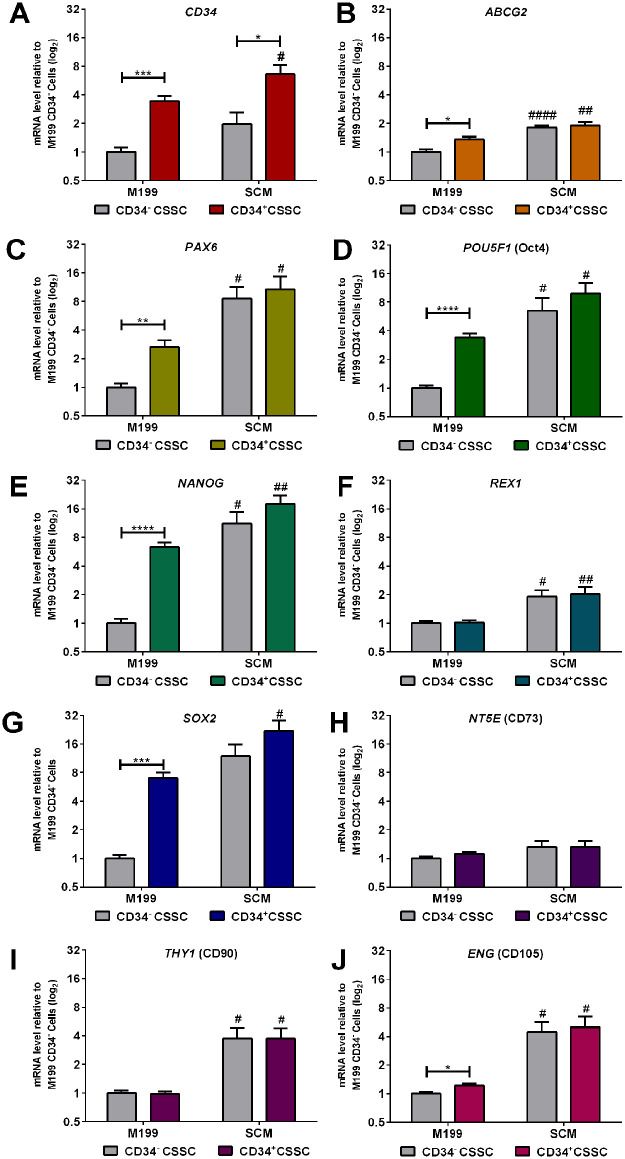
Figure 5.
Differences in gene expression between CD34+ and CD34− C-MSC. Cells that were cultured in either SCM or M199 were sorted at P1 for CD34 expression. Relative levels of mRNA were determined by RT-qPCR for the following genes (A) CD34 (B) ABCG2, (C) PAX6, (D) POU5F1, (E) NANOG, (F) REX1, (G) SOX2, (H) NT5E, (I) THY1, (J) ENG. Expression of each target gene was normalized to GAPDH and represented relative to mRNA expression in CD34− cells in M199. Data shown as mean ± SEM of five independent experiments with five different C-MSC donors (n = 5), each with two replicates. Statistical significance of CD34− vs. CD34+ in M199 or SCM: *P ≤ 0.05, **P ≤ 0.01, ***P ≤ 0.001, ****P ≤ 0.0001. Statistical significance of M199 vs. SCM for CD34− or CD34+ cells: #P ≤ 0.05, ##P ≤ 0.01, ####P ≤ 0.0001.

