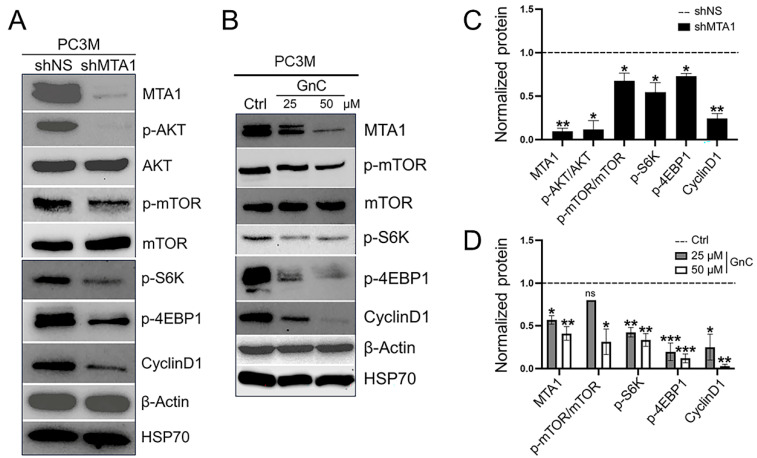
Figure 3.
(A) Representative Western blot analysis and quantitation of molecular markers of MTA1/mTOR signaling pathway in PC3M MTA1-expressing (shNS) and MTA1 knockdown (shMTA1) cells. (B) Gnetin C inhibits MTA1/mTOR pathway markers in a dose-dependent manner. β-actin and HSP70 were used as loading controls. (C) Quantitation analysis of molecular markers in PC3M shNS and shMTA1 cells. (D) Quantitation analysis of molecular markers in PC3M cells treated with 25 and 50 µM of gnetin C (GnC). Quantitation represents mean ± SEM of three independent experiments. * p < 0.05; ** p < 0.01; *** p < 0.001; ns, non-significant (Student’s t-test and one-way ANOVA). The uncropped blots are shown in File S1.

