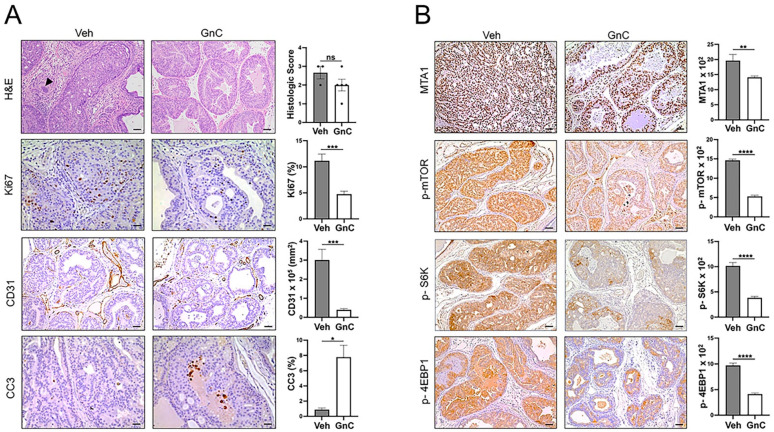
Figure 5.
(A) Left: Representative images of H&E (scale bar, 50 µm). An island of neoplastic epithelial cells invading the adjacent fibrous connective tissue is present (arrowhead). The IHC staining of Ki67, CC3 (scale bar, 20 µm), and CD31 (scale bar, 50 µm) in the prostate tissues from vehicle-treated and gnetin C-treated mice. Right: The quantitation of prostate glands involved in PIN vs. adenocarcinoma and the quantitation analysis of Ki67, CD31, and CC3 staining. (B) Left: Representative images of molecular markers of the MTA1/mTOR pathway in the prostate tissues from vehicle (Veh)-treated and gnetin C (GnC)-treated mice. Right: The quantitation of MTA1, p-mTOR, p-S6K, and p-4EBP1 (scale bar, 50 µm) staining. Values are mean ± SEM analyzed from five to seven separate areas per sample (Veh, n = 3 and GnC, n = 5). * p < 0.05; ** p < 0.01; *** p < 0.001; **** p < 0.0001; ns, non-significant (Student’s t-test).

