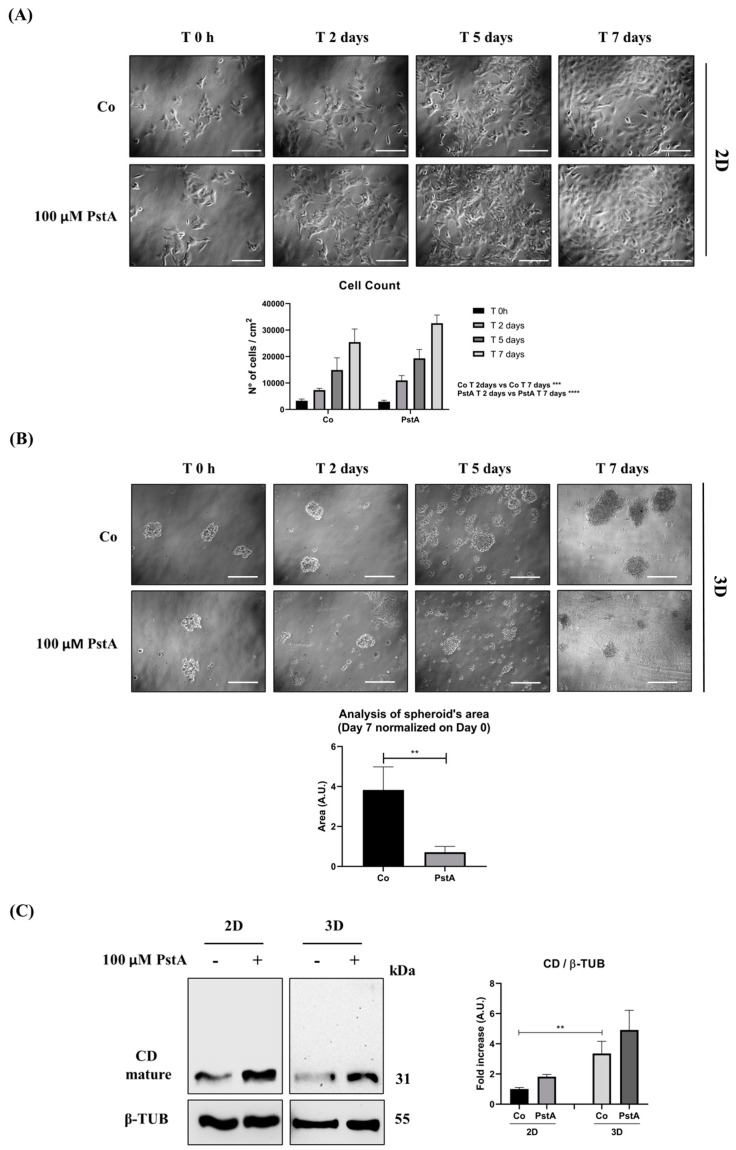
Figure 4.
Cathepsin D expression differs in 2D and 3D SH-SY5Y cell cultures. SH-SY5Y cells were seeded both in adherent and non-adherent Petri dishes, at 4000 cells/cm2 and 1,000,000 cells/Petri, respectively, and allowed to grow for 48 h. Medium was refreshed every 48 h, supplemented with 100 μM PstA where indicated. (A) Cell growth was monitored at the phase-contrast microscope and images were acquired at the time point indicated (time 0 h, 2-, 5- and 7-days). Scale bar = 100 μm; magnification = 20×. Viable SH-SY5Y cells grown in adherent condition were counted, and data from triplicate for each experimental condition are shown in the graph. One-way ANOVA test was performed. Significance was considered as follows: **** p < 0.0001; *** p < 0.001. (B) The spheroid’s growth was monitored at the phase-contrast microscope, and images were acquired at the time point indicated (time 0 h, 2-, 5- and 7-days). Scale bar = 100 μm; magnification = 20×. The quantification of 3D spheroid’s size was performed with ImageJ software (v.1.48). The area is indicated as arbitrary unit (A.U.). Data represent the average ± S.D. calculated for at least 5 to 10 spheroids for each condition in three separate experiments. t-test was performed. Significance was considered as follows: ** p < 0.01. (C) Western blotting analysis of CD expression in 2D and 3D cell homogenates. The membrane was probed with β-tubulin as loading control. The blot is representative of three independent experiments. Densitometry of the bands is reported in the histogram. Two-way ANOVA test was performed. Significance was considered as follow: ** p < 0.01. “Co” refers to untreated cells (control).

